Author Archives: Andreas Muenchow

CCGS Henry Larsen: People, Places, Services

The Canadian Coast Guard Ship Henry Larsen sailed this summer on a challenging science mission to Nares Strait, Petermann Glacier, and beyond. It reached its farthest North ever at 82 degrees and 15 minutes North latitude. This week I like to focus on the 39 people who make this ship what it really is: a complex community with all the functionality of a city. Captain Wayne Duffett is in overall command. His job will overwhelm lesser minds as he has to manage an airport, a fire department, a power plant, a sanitation department, a hospital, a restaurant, a hotel, a supermarket, a weather station, a port facility, a civil administration, etc., etc. Oh yeah, The CCGS Henry Larsen is also a ship that he moves through ice in uncharted waters to support 8 scientists from 3 countries. All of this is done with only 22 crew and 17 officers who work around the clock on a variety of schedules.
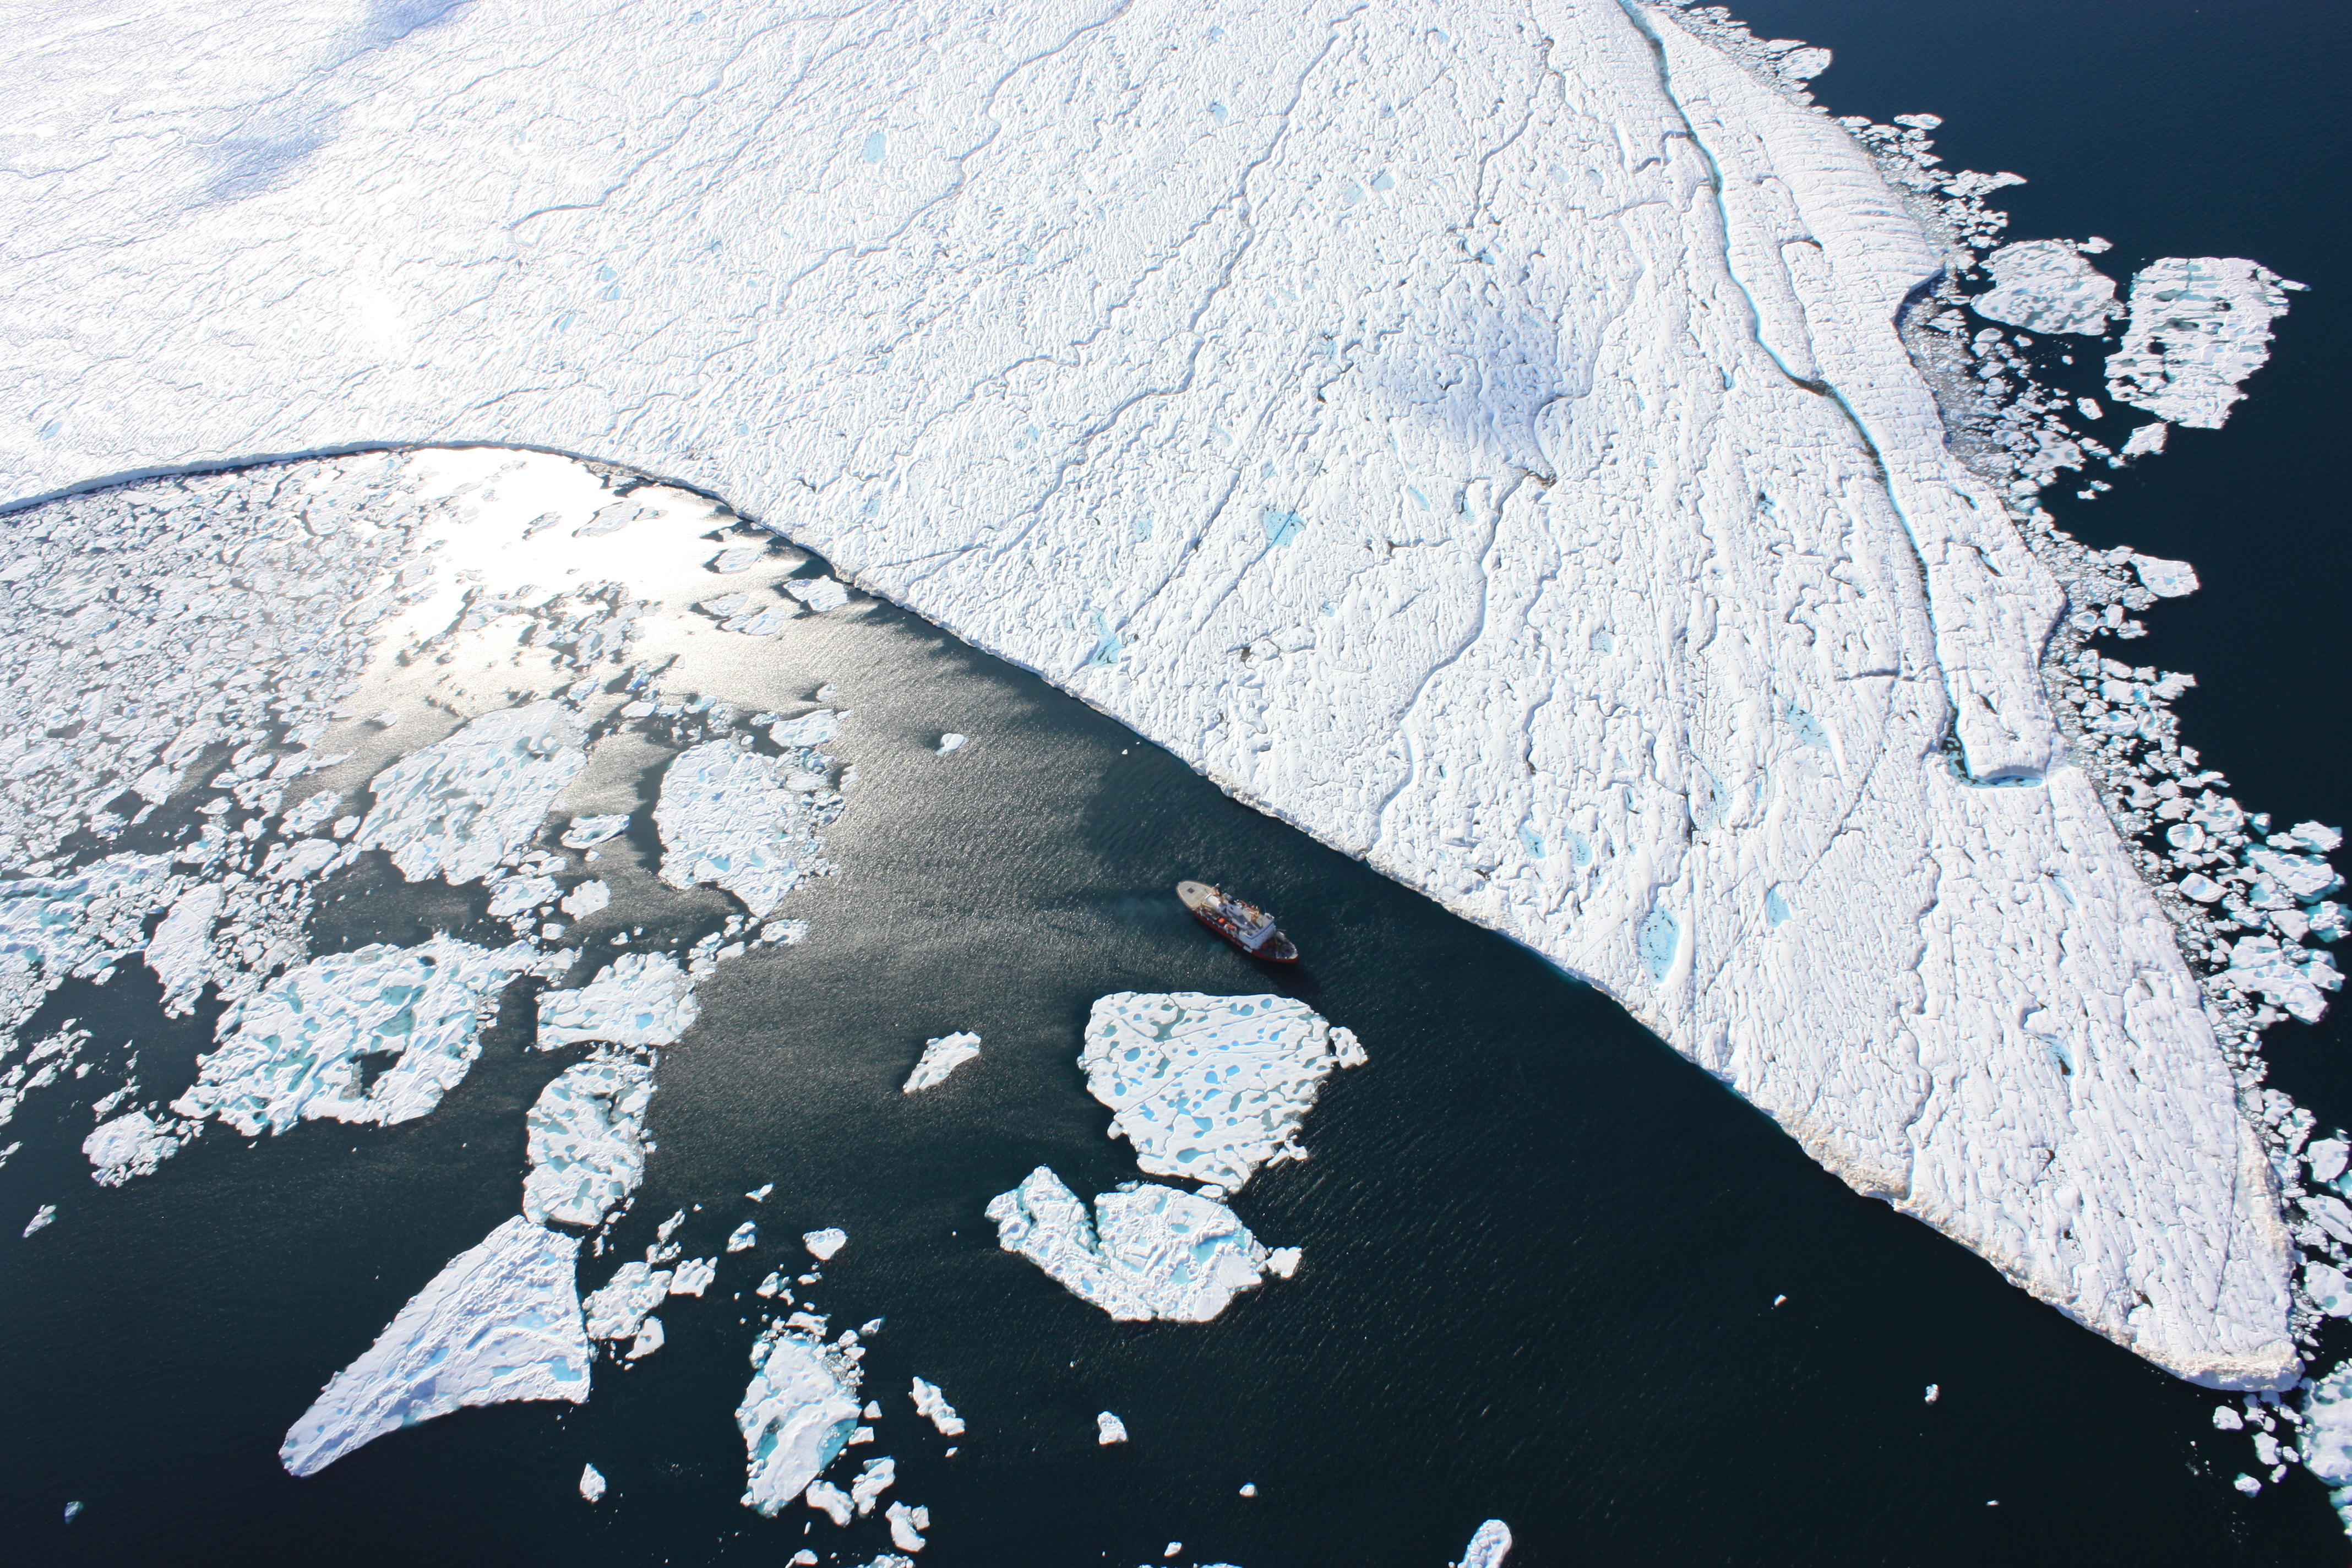
CCGS Henry Larsen next to the Petermann Ice Island PII-2012 on Aug.-10, 2012. The south-western tip of PII-2012 at the bottom right of the image was used by Captain Wayne Duffett as a reference point for the motion of PII-2012. The exact place of this point was monitored at hourly intervals via helicopter while the ship was operating inside the fjord landward of the ice island. [Photo Credit: Canadian Coast Guard Ship Henry Larsen/Jo Poole]
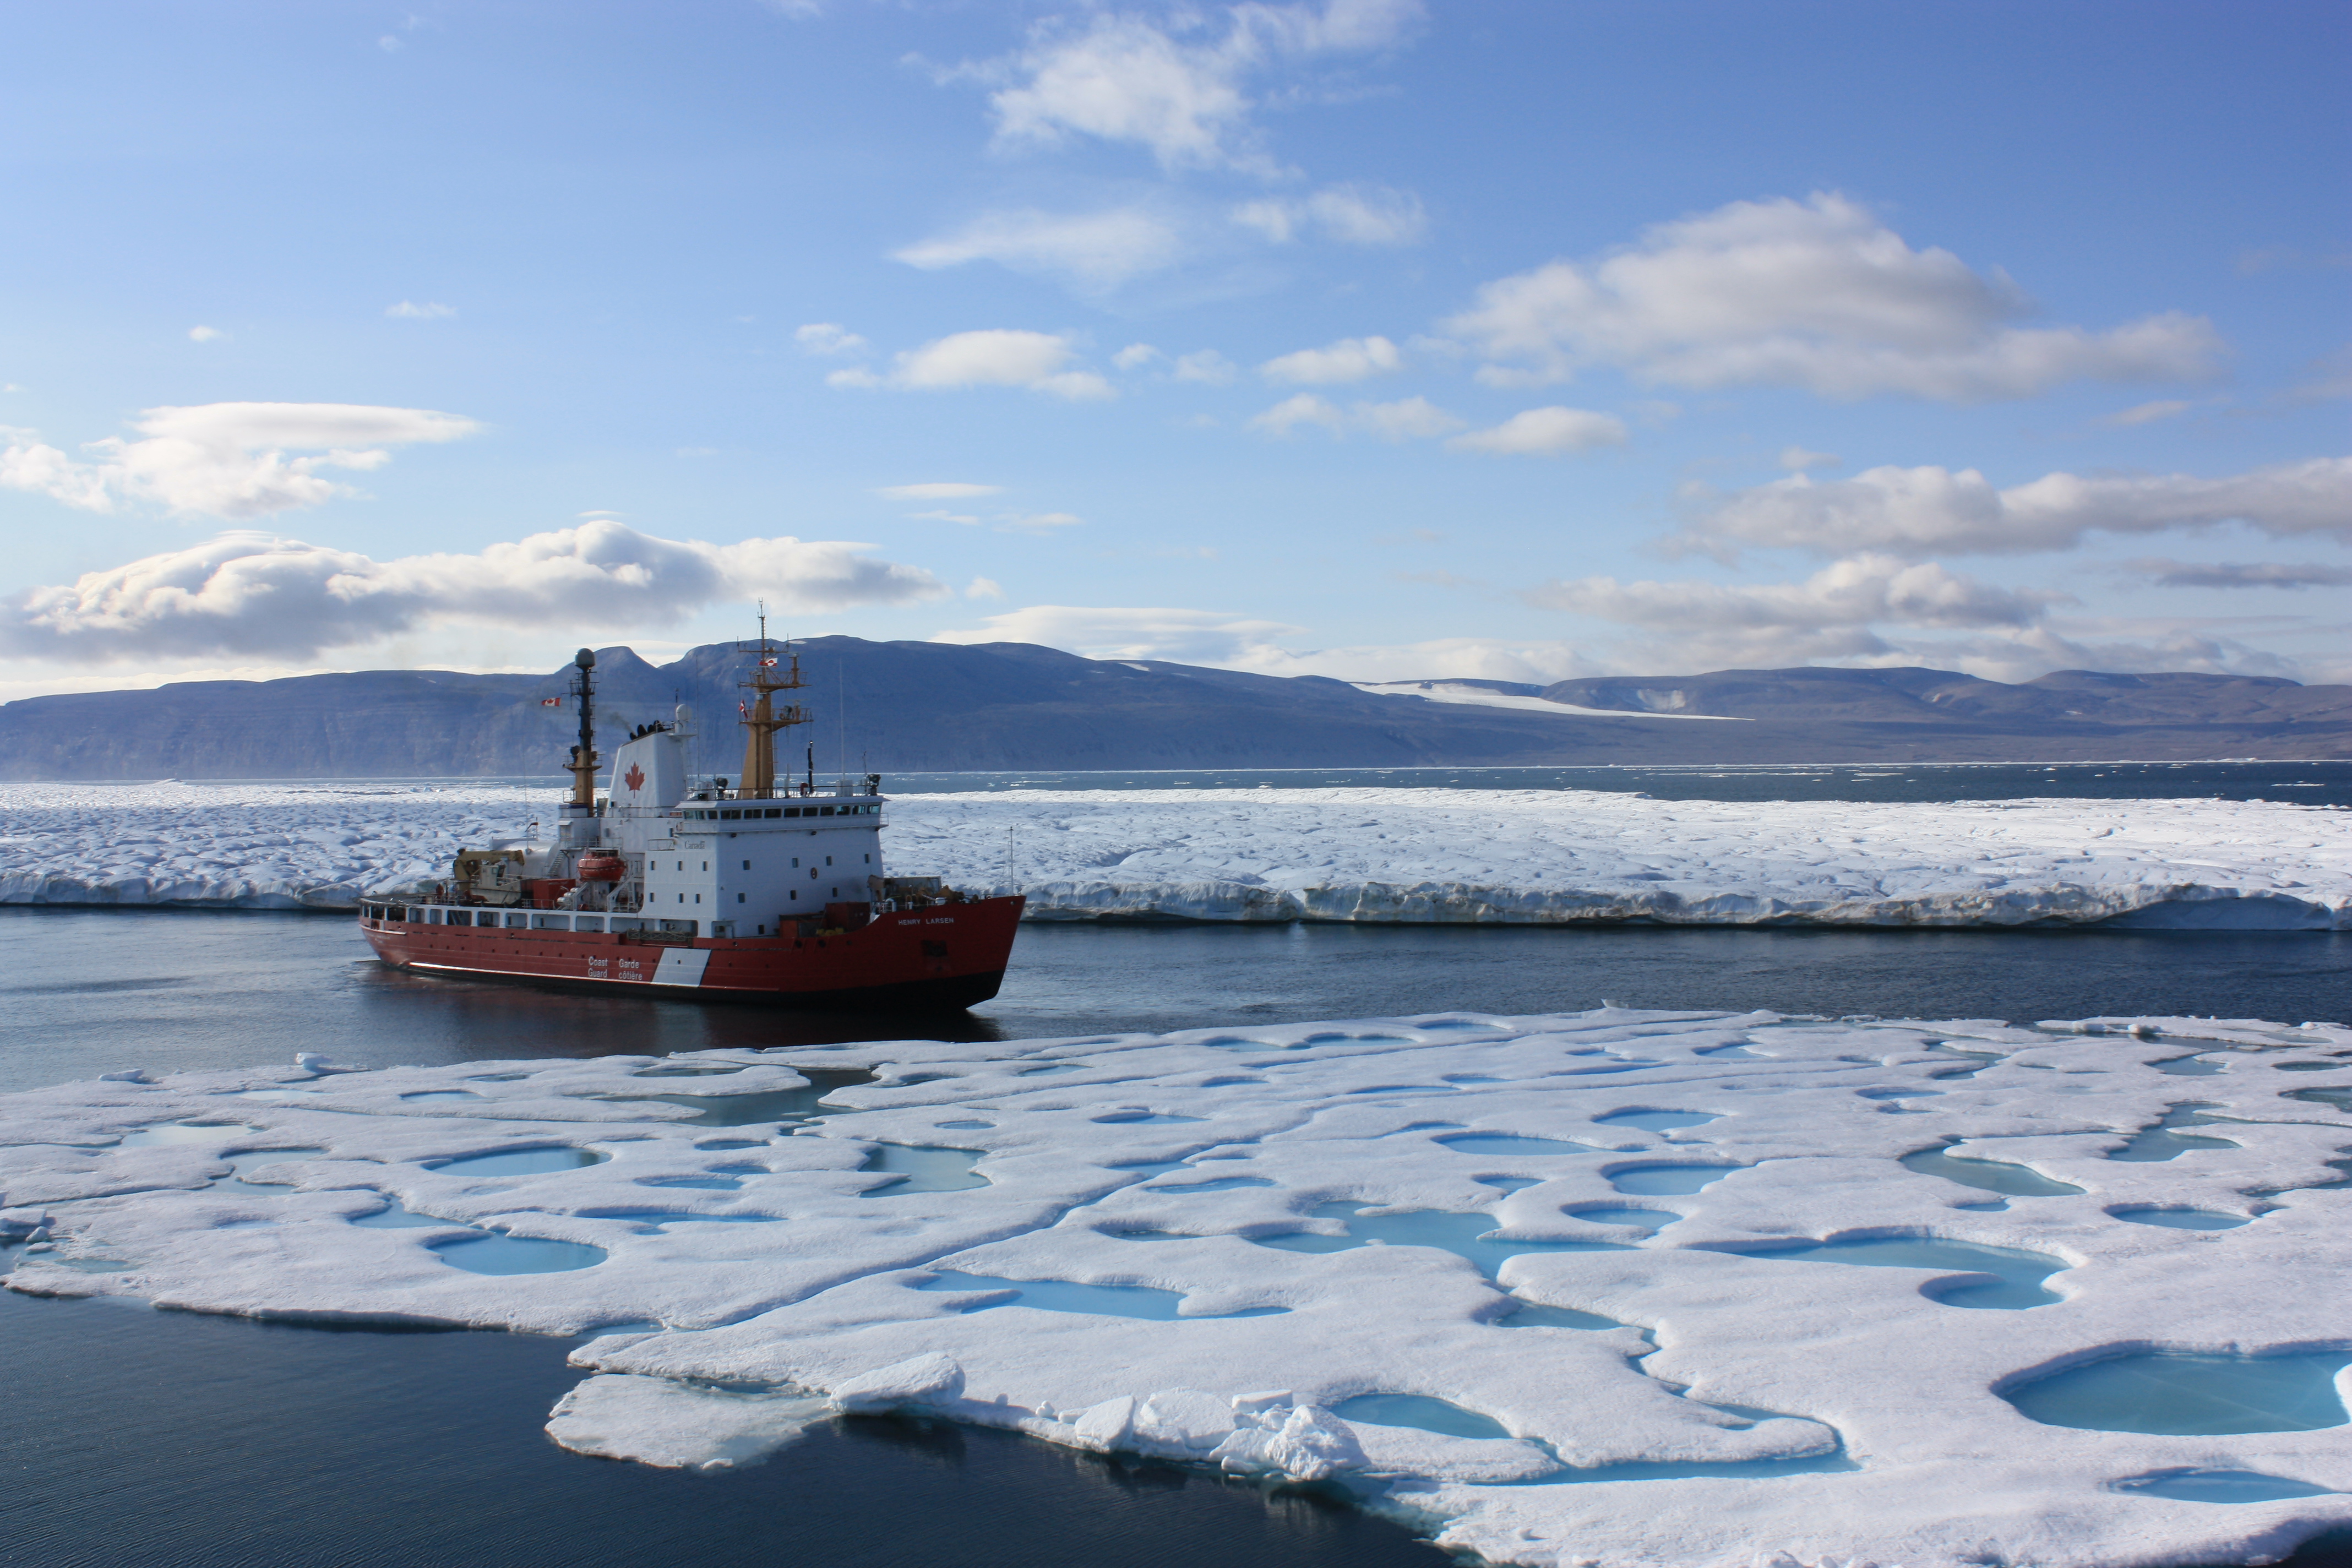

Canadian Coast Guard Ship Henry Larsen at the entrance to Petermann Fjord on Aug.-10, 2012. The ice island PII-2012 is in the background with puddles on sea ice in the foreground. Polaris Bay, Greenland is in the far back. [Photo Credit: CCGS Henry Larsen and Jo Poole.]

The ship may occupy an area of only 2,000 m^2 (100 meters long and 20 meters wide), but it functions as a self-contained universe at sea. Perhaps the most important and largest department with 13 people is the power plant that produces energy to move the ship and to provide electricity and heat to make all other departments’ work possible. The 13 members are quiet and thoughtful men often working in the background in cramped, hot, and dirty spaces below decks. It is very hard to get good pictures of them, but here are two, one of Chief Engineer William Derraugh and Second Electrical Officer Anatoly Eltsov:
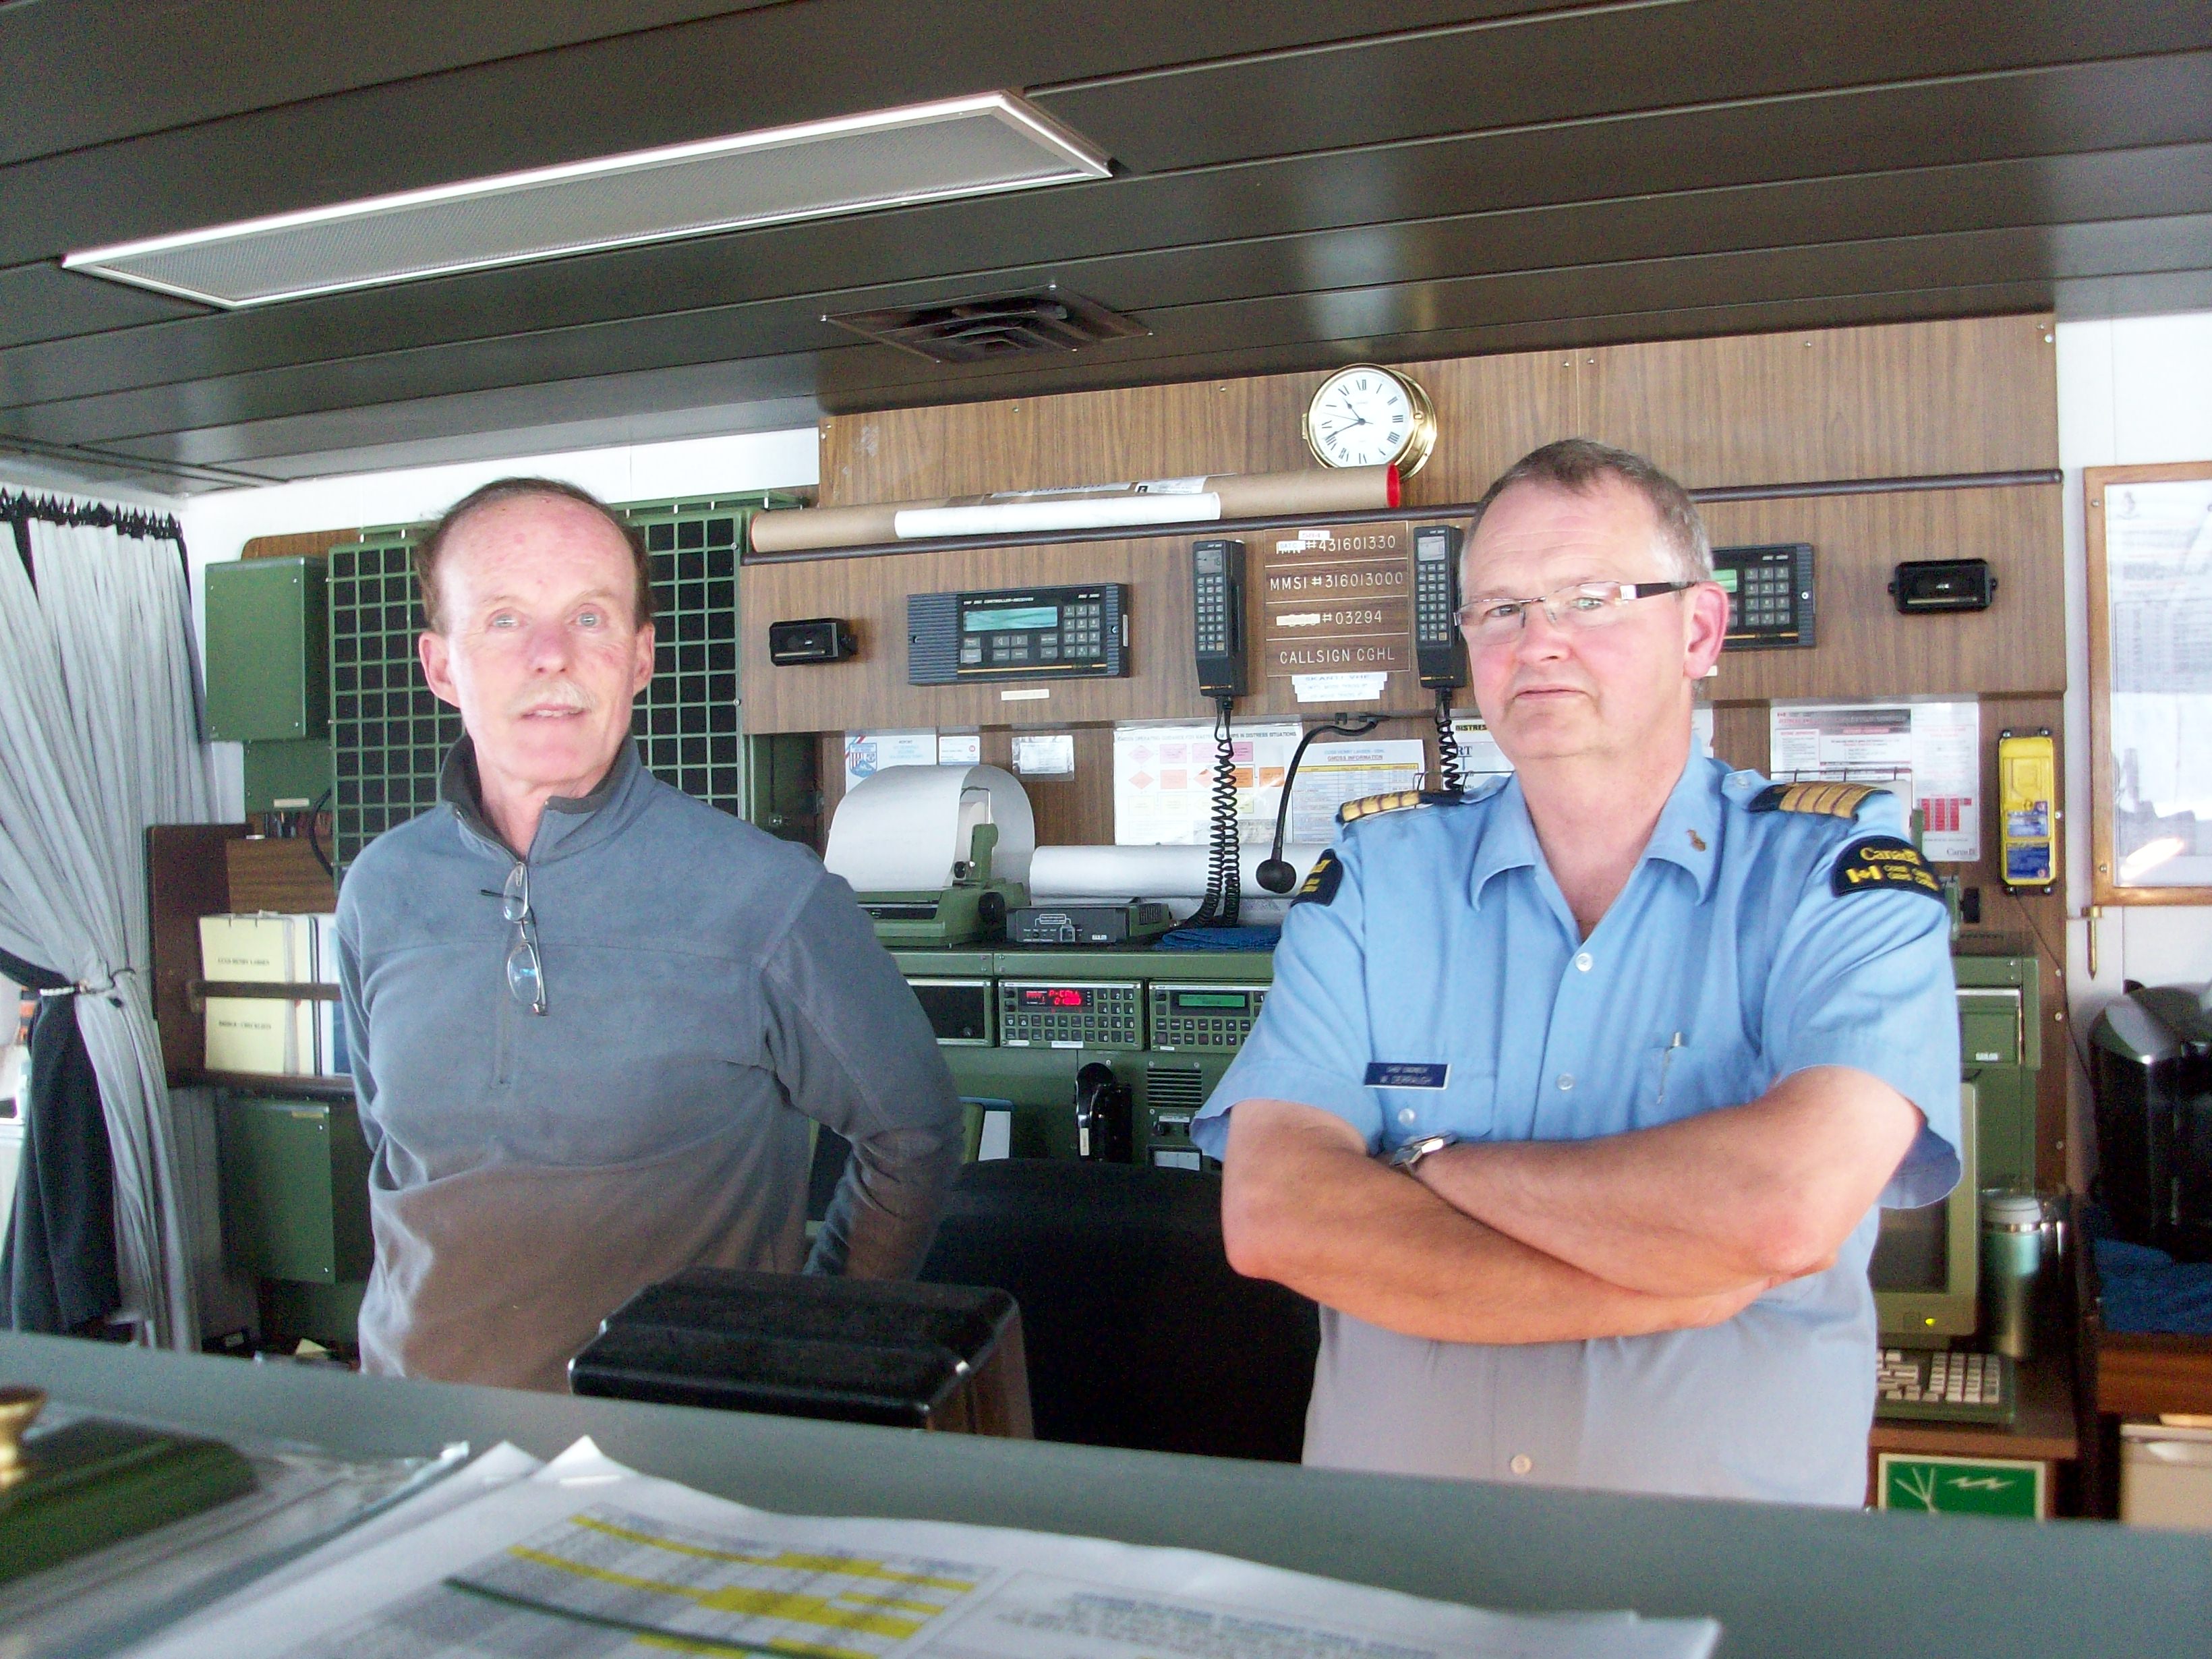
Chief Engineer William Derraugh on the bridge of the CCGS Henry Larsen in Aug.-2012 with Senior Scientist Dr. Humfrey Melling. [Photo Credit: Barb O’Connell, Canadian Coast Guard.]
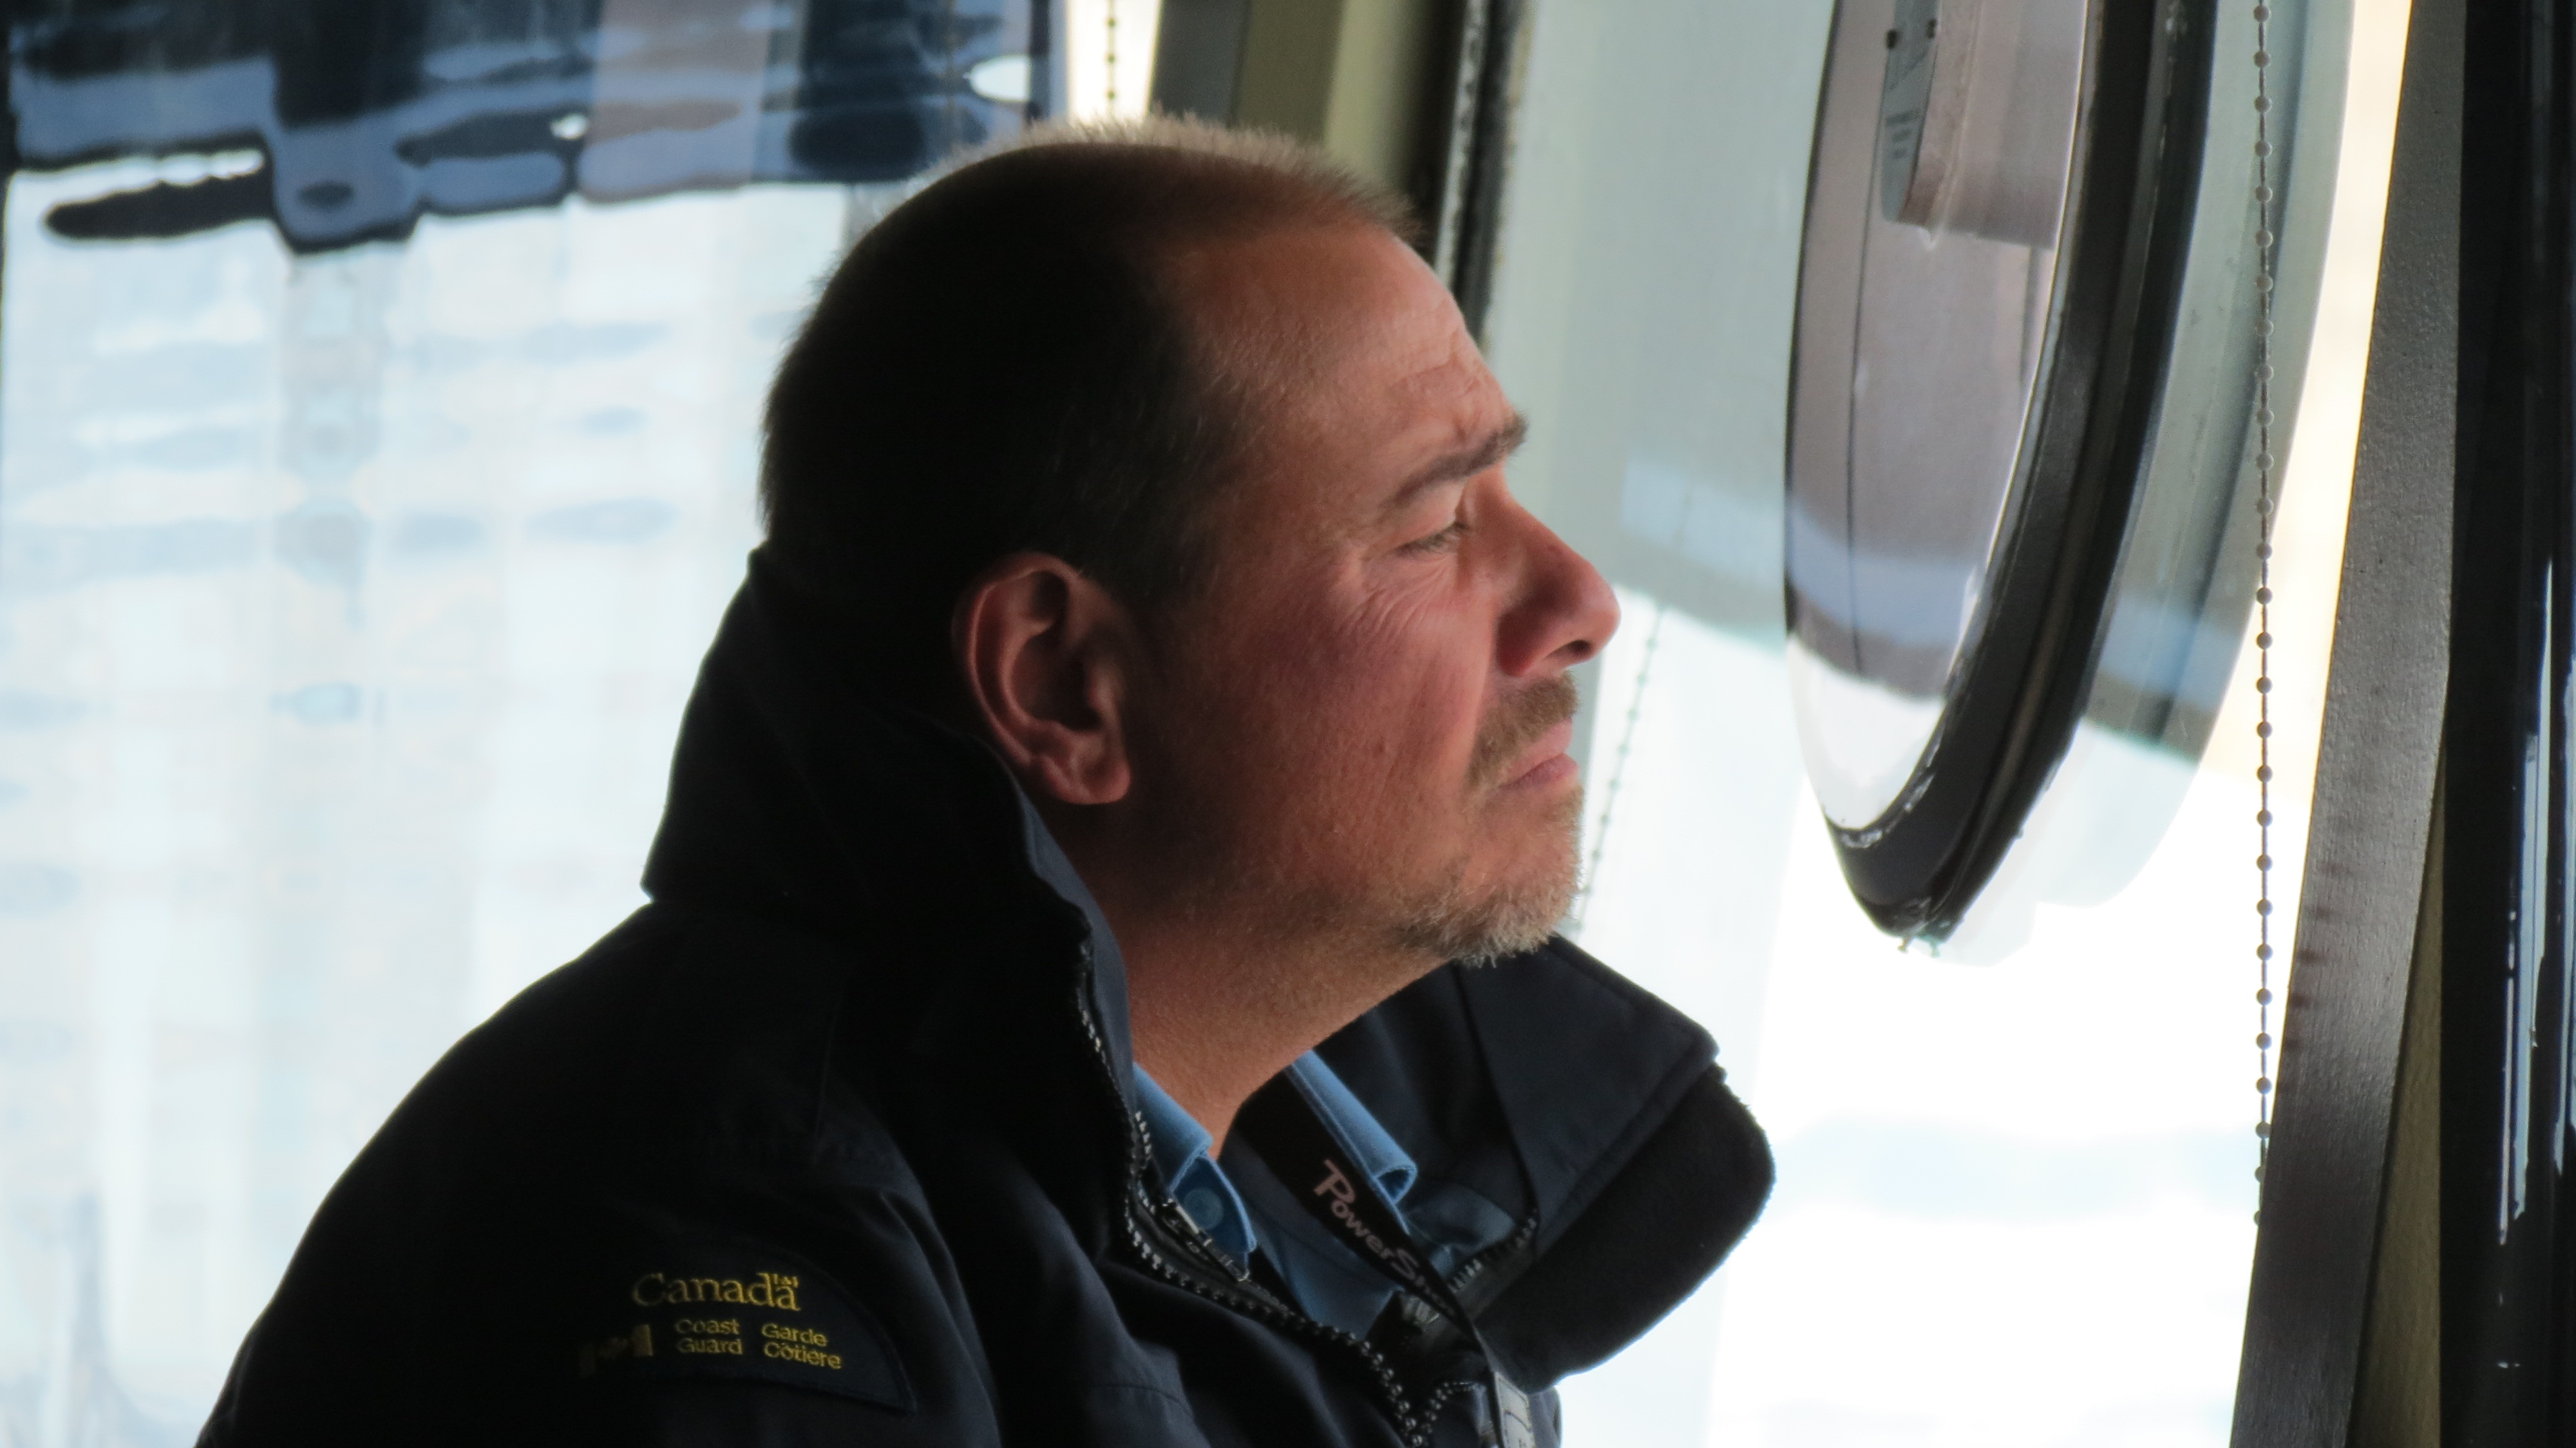

Electrical Officer Anatoly Eltsov during a thoughtful moment on the bridge of the Canadian Coast Ship Henry Larsen in Nares Strait. [Photo Credit: Kirk McNeil, Canadian Coast Guard]

The second-largest department is the fire department that also run the port facilities, the fishing fleet, and provide general support on deck, on the bridge, on the water, and on land to a range of activities. There are nine men in this department that are led by the boatswain or bosun Don Barnable with Chief Officer Brian Legge in command. The men of this department are perhaps the most vocal and visible on the ship as they work so many jobs wearing many hats, uniforms, and arms. I can and will fill entire picture galleries of their work, here are just three images that barely serve as teasers, perhaps:
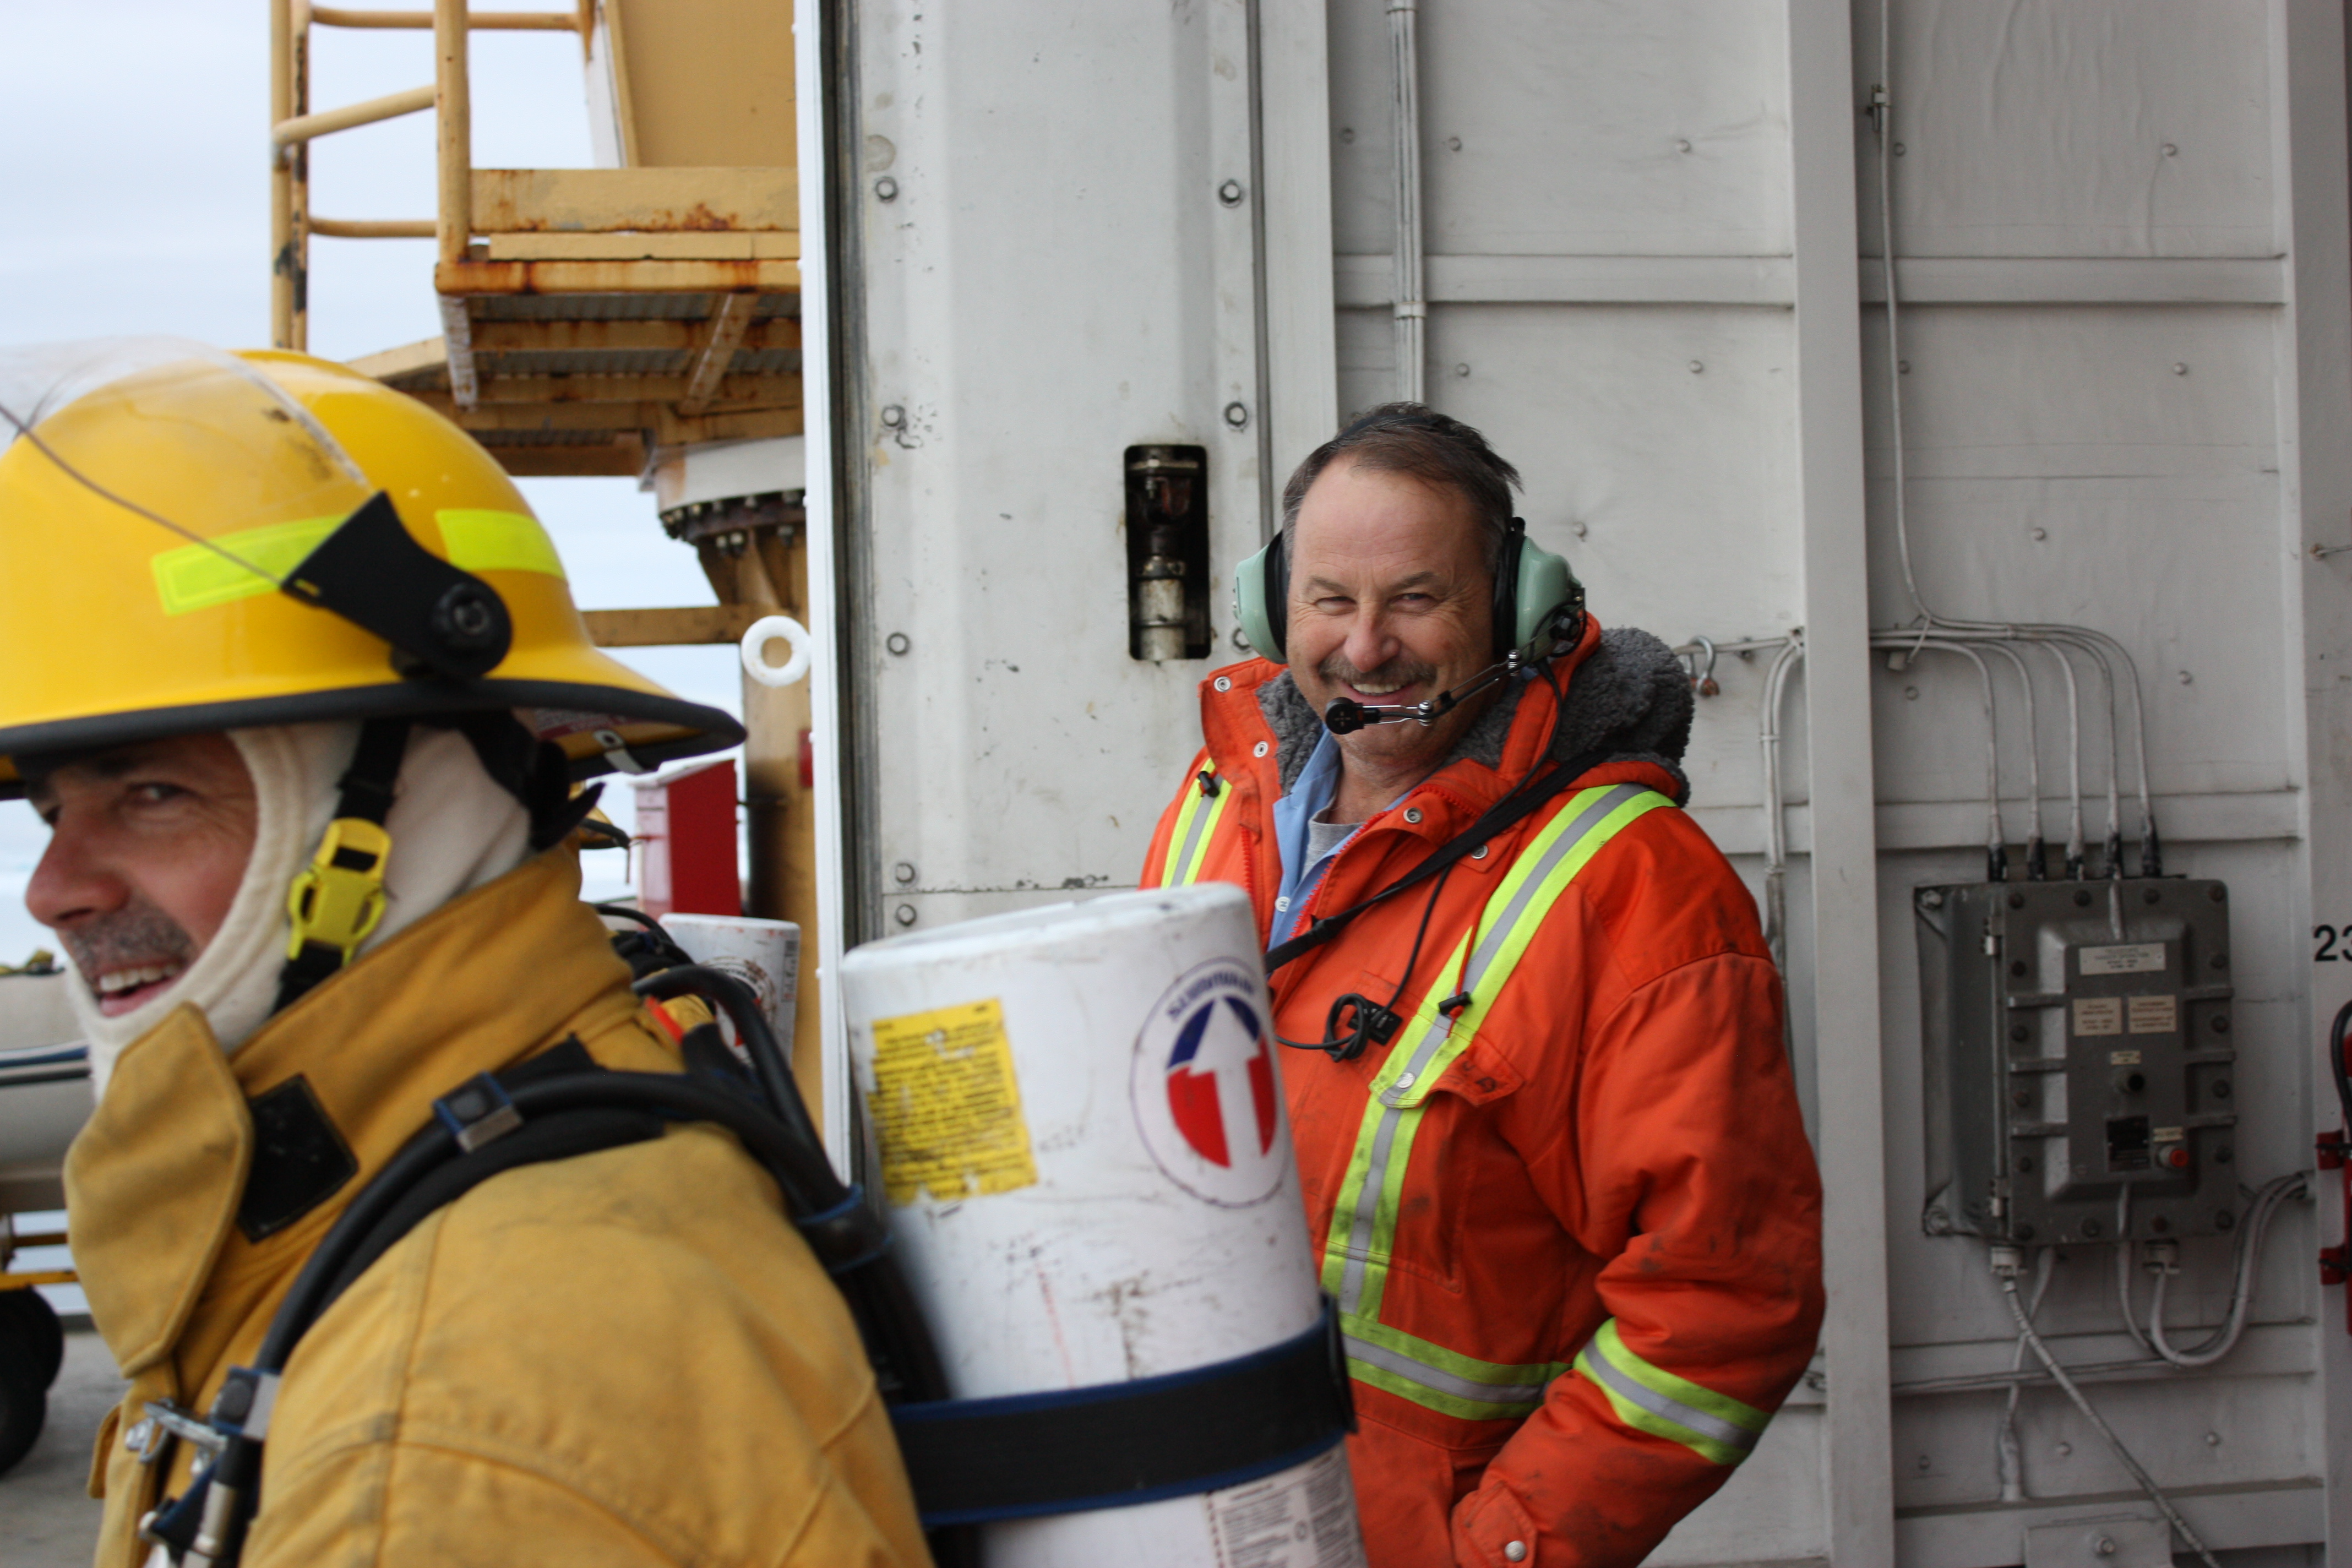
Boatswain Don Barnable and Seaman Derick Stone working at the airport aboard the CCGS Henry Larsen as traffic control and fire fighter, respectively. [Photo Credit: Jo Poole, British Columbia]
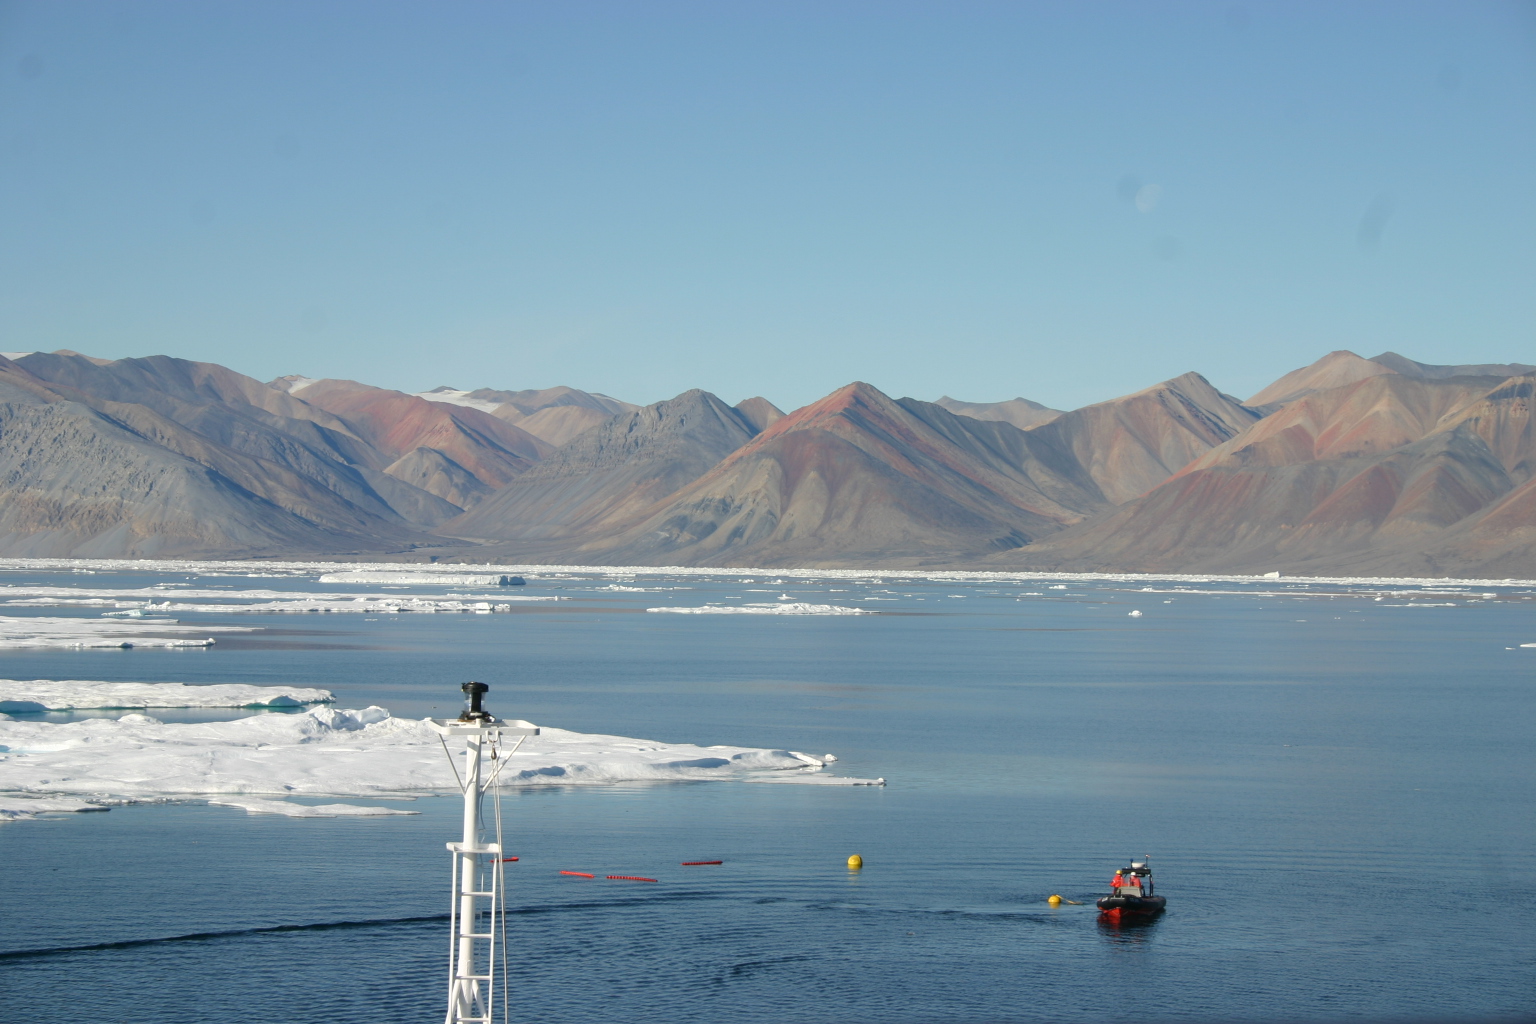

Zodiac of the CCGS Henry Larsen recovering a mooring in Kennedy Channel on Aug.-6 with Chief Officer Brian Legge at the helm. Ellesmere Island, Canada is in the background. [Photo Credit: Canadian Coast Guard Ship Henry Larsen]
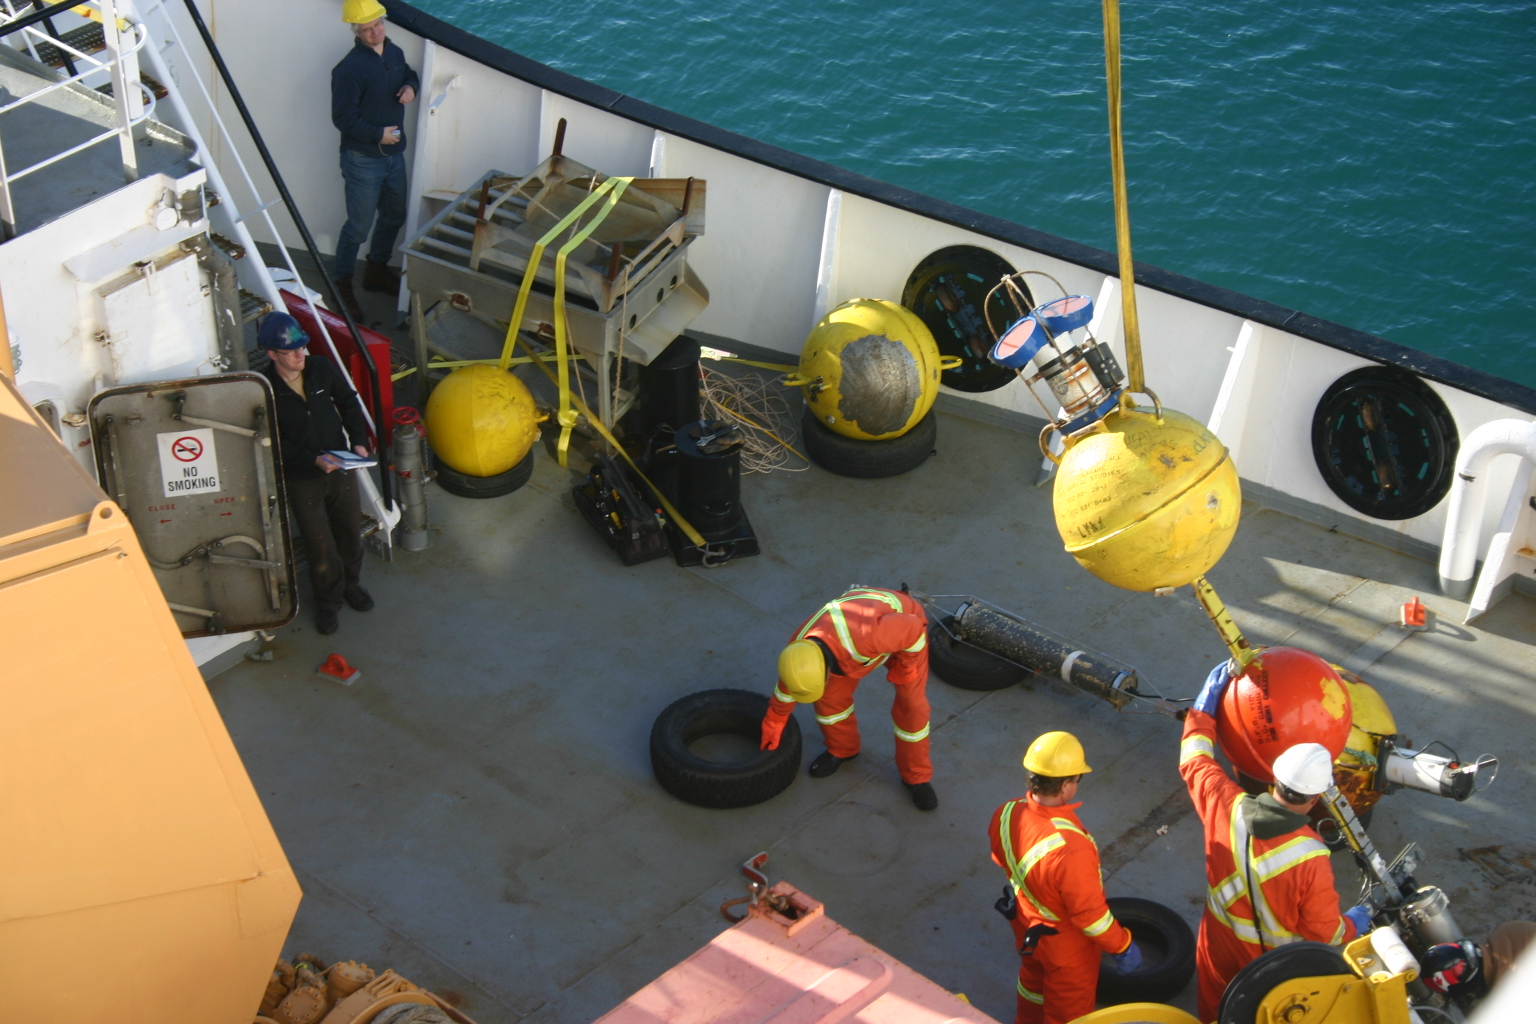

Deck crew of CCGS Henry Larsen led by boatswain Don Barnable (white helmet) recovering a mooring over the side where the zodiac delivered it to the crane. Two scientists in the background waiting for the deck to be secure. [Photo Credit: Canadian Coast Guard Ship Henry Larsen]

I will have to stop here for now, and will report tomorrow and thursday about the logistics, communication, aviation, hospital, and civil administration departments. There is just too much going on aboard a ship that acts like a complex, advanced, and very mobile city. And with mobile I do not just mean a structure of steel, but a structure made of sailors, navigators, scientists, and engineers.
Petermann Ice Island 2012 Breaking Up

Dr. Preben Gudmandsen pioneered some of the early micro-wave remote sensors 30-40 years ago that are now used routinely to monitor sea ice, snow, and glaciers. Despite being “retired” for over 20 years, this Danish professor of Electrical Engineering is still very active in all things related to Nares Strait from sea ice, oceanography, glaciers, and winds. He is one of the main instigators to set up the automated weather station at Hans Island.

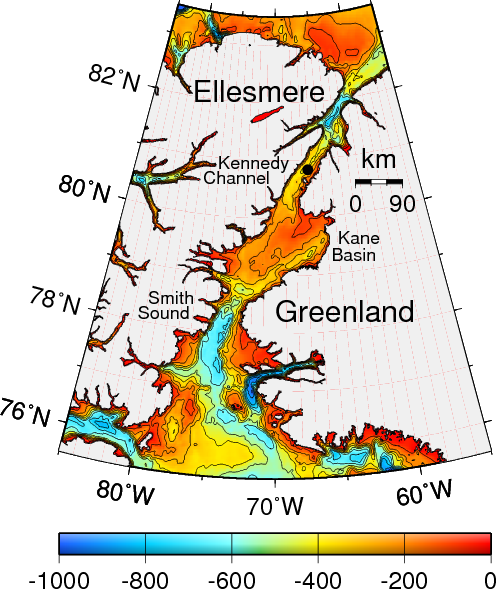
Nares Strait bottom depth (in meters) according to the International Bathymetric Chart of the Arctic Ocean (IBCAO, version 2, 2008). The black dot in the center of Nares Strait indicates Hans Island.

He also instigated the latest round of exchanges among “Friends of Nares Strait” about the fate of the ice island that broke off earlier this summer from Petermann Gletscher. He asked yesterday what may happen if PII-2012 reaches the sill separating northern Nares Strait and the Arctic Ocean from southern Nares Strait and the Atlantic Ocean. This sill is the deepest connection between the Arctic Ocean to the north and Baffin Bay in the south. The sill is in western Kane Basin off Ellesmere island and is about 220 meters deep.

So, to answer that question one needs to know three things: Where is the ice island, how deep is the water where it is, and how thick is the ice island. Before I could assemble these three things, however, the ice island has already broken into at least three pieces. Luc Desjardins of the Canadian Ice Service answered first by pointing this out. He has access to the commercial RadarSat data that few others have. So, here is the latest from MODIS which answers the first two questions:

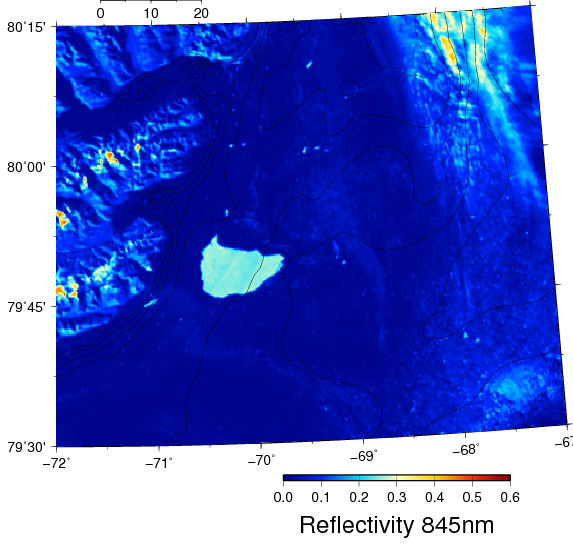
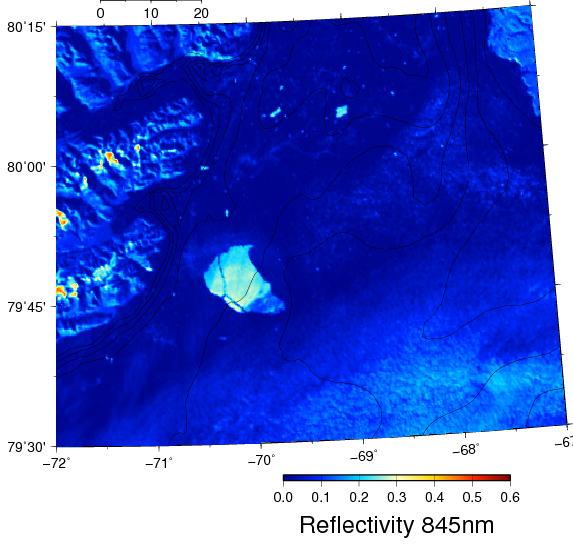
Petermann ice island 2012 (PII-2012) breaking apart on Sept.-1, 2012 near the sill of Nares Strait. Faint black lines are bottom contours of 200, 150, 100, and 50 meter depth (IBCAO-2). Bottom left has clouds, top right is the mountainous terrain of Ellesmere Island. The most southerly part of PII-2012 is the thickest as it was attached to the glacier earlier this year. The most northerly section connected to PII-2010 which passed a moored array in place near Hans Island on Sept.-22, 2010.

Petermann Ice Island 2012 as one piece on Aug.-30, 2012 19:20 UTC in Kane Basin over contours of bottom topography.

From the above two MODIS images over contours of bottom topography, the shallowest water that PII-2012 has seen is the 150-m contour to the east towards Greenland. It is possible, however, that PII-2012 may also have hit some shallow topographic feature not properly charted in IBCAO-2008 (there is a 2012 version, I just learnt) or not properly contoured by me. Lets move on the next question, how thick is this ice island?

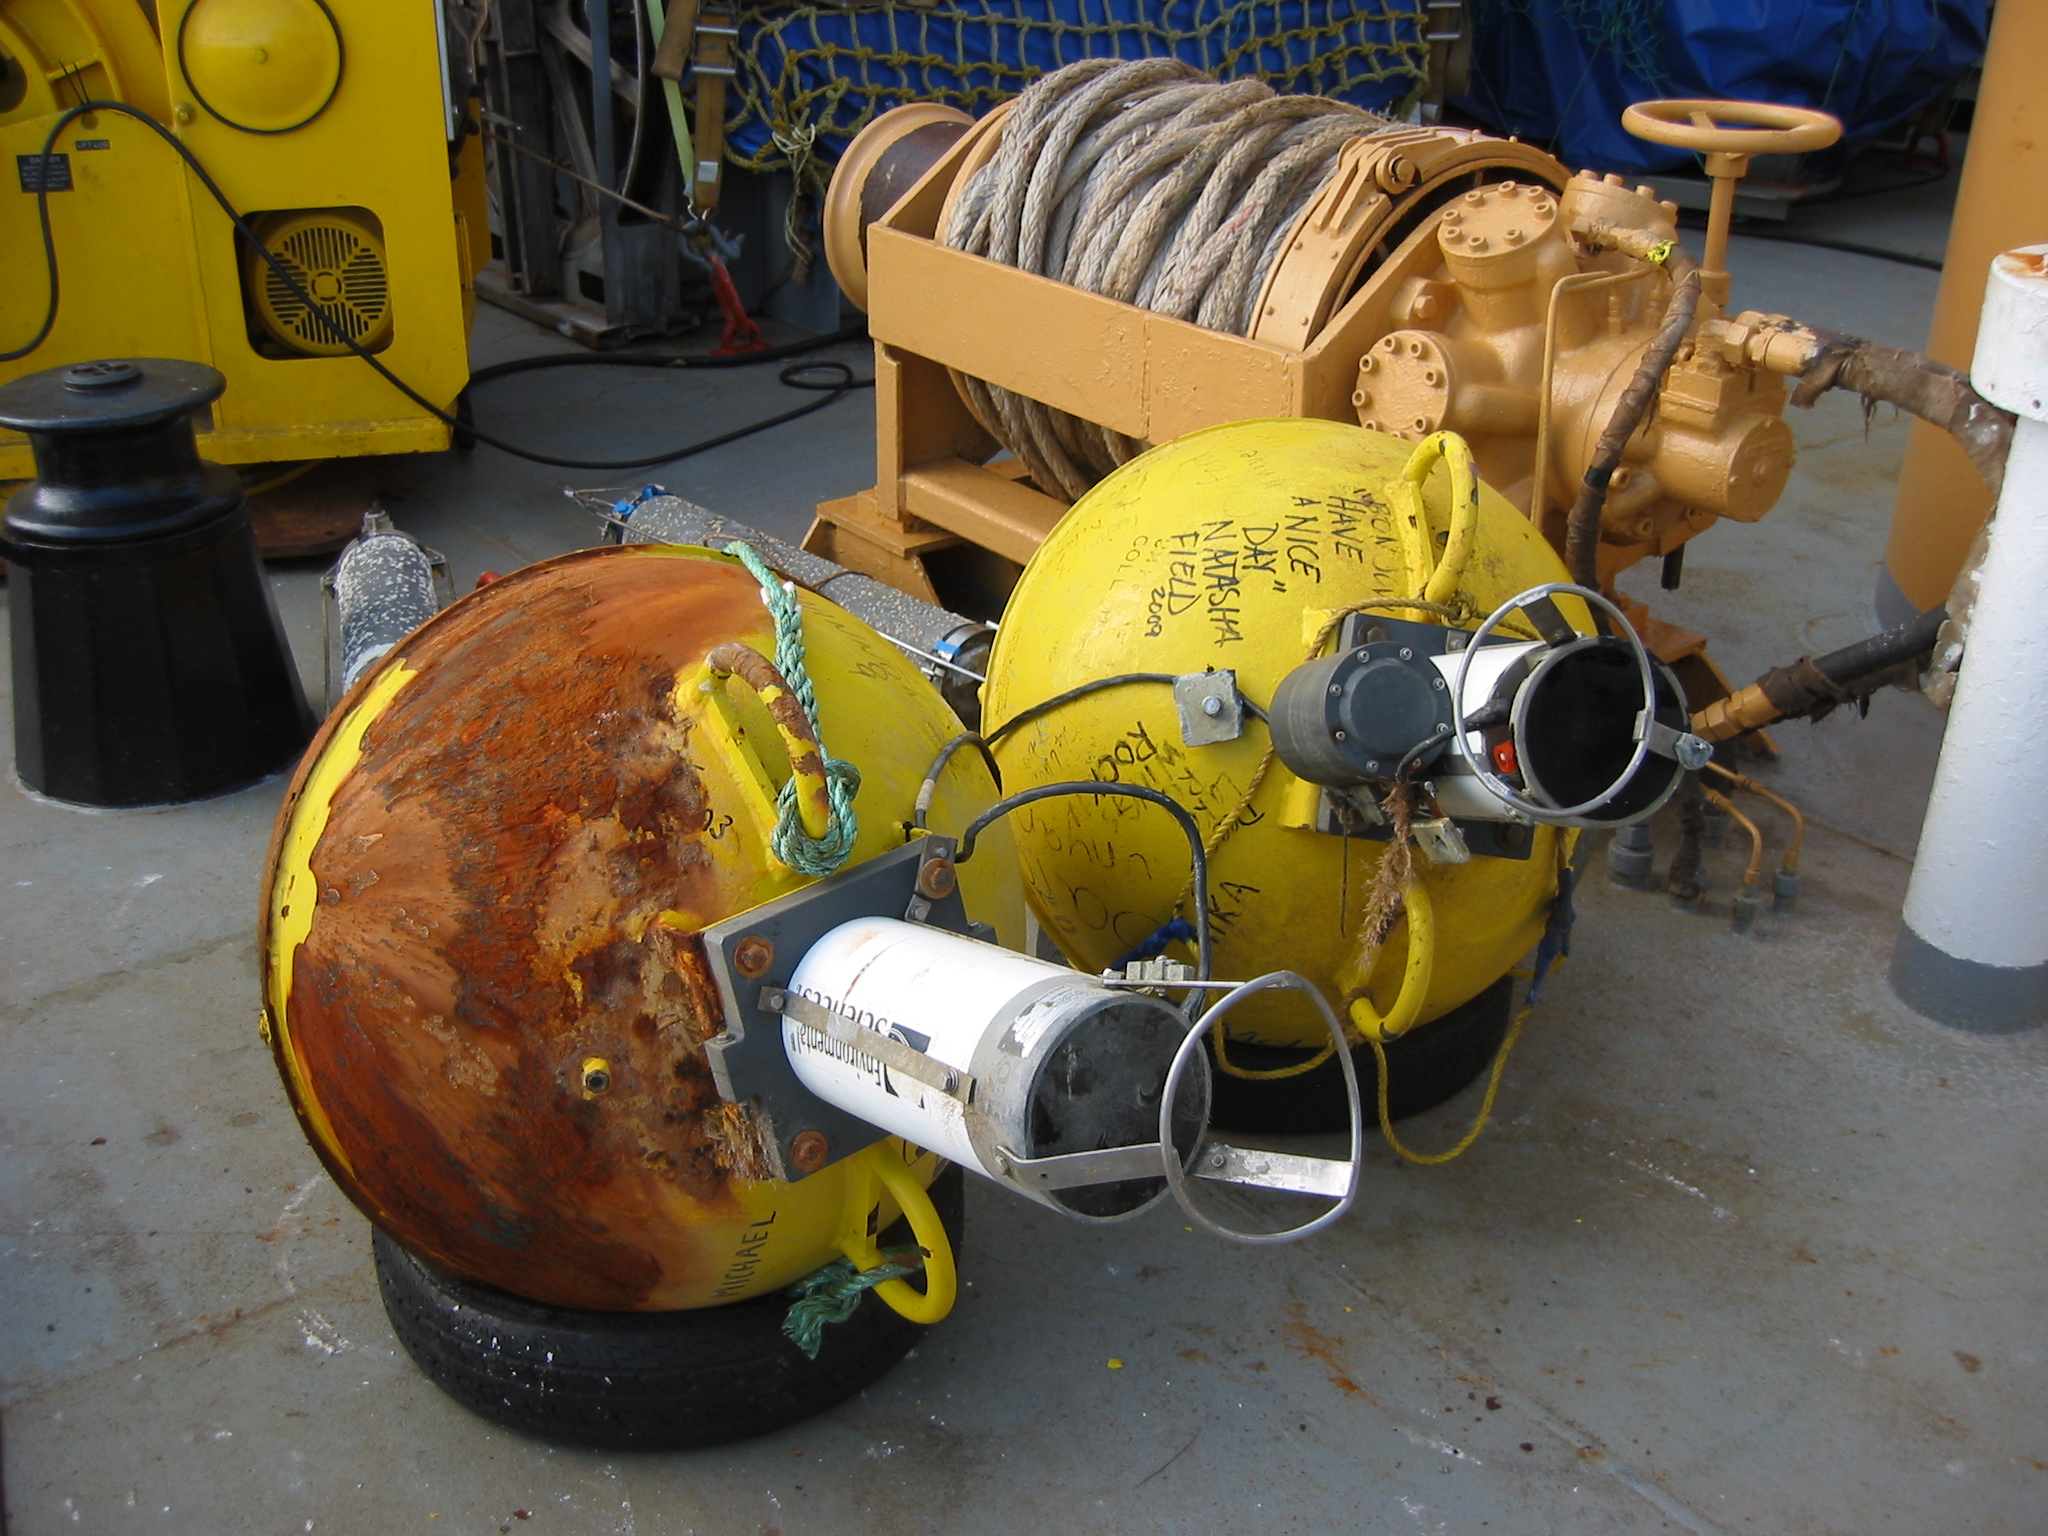
From data we recovered 3 weeks ago I can say, however, that PII-2012 is thicker than 144 meters. I base this estimate on the ice island that formed in 2010 and that passed over our moored array on Sept.-22, 2010. It hit two ice profiling sonars at 75 meters and damaged the stainless steel guard cage designed to protect the sensors (which they did), e.g.,

Two Ice Profiling Sonars (IPS) aboard the CCGS Henry Larsen in Aug.-2012. The bent stainless steel protective frame was bent by the 2010 ice island that hit both instruments in Sept.-2010. [Photo Credit: Andreas Muenchow]

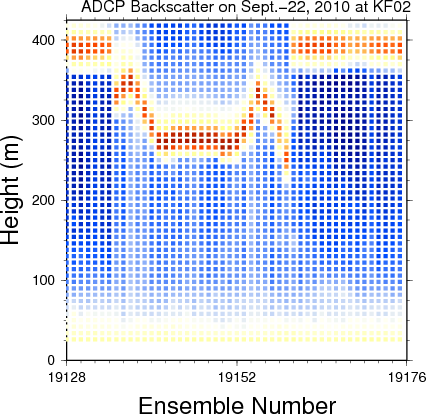
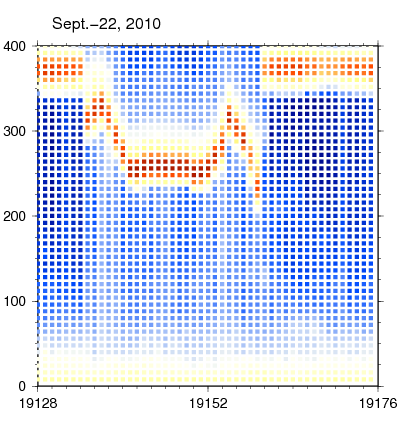
Another instrument moored deeper at ~360 meter depth sends out acoustic pings and measures how much sound comes back. A weak scatter like some microscopic plankton or grain of mud or sand in the water reflects little energy, but a hard surface like the ice floating atop reflects lots. And here is how a time series of this backscattered energy looks like when an ice island passes over:

A 24-hour segment of acoustic backscatter from a bottom-mounted acoustic Doppler current profiler is show to vary with time and height above the bottom. The dark red represents the sea surface and/or the bottom of ice floating on it. Vertical resolution is 8 meters, temporal resolution is 30 minutes for a 3-year deployment. The main purpose of this instrument is to measure ocean currents at the same spatial and temporal resolution as shown here for backscatter. PII-2012-B passed over the instrument on Sept.-22, 2010 and is here estimated to be about 144 meters thick.

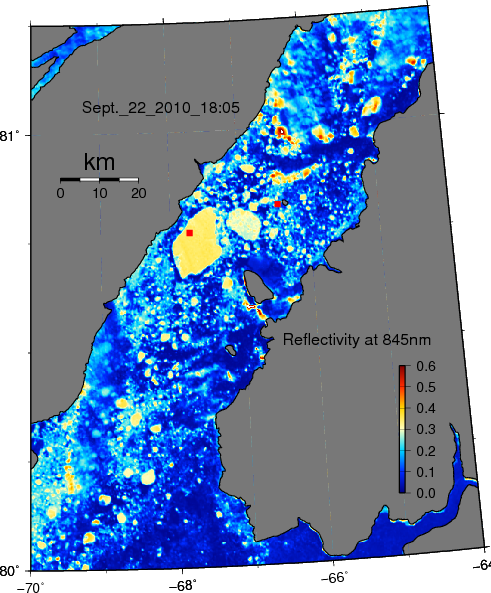
The exact place of the mooring and the time that PII-2010-B was on Sept.-22, 2010 is shown in this MODIS image of that day:

Location of ADCP mooring site (red square) with Petermann Ice Island 2010 segment B overhead on Sept.-22, 2010.

If you like puzzles, then you will like physical oceanography or any field of science or engineering. If you like puzzles, you will correctly notice, that the flat segment of PII-2010-B oriented parallel to the shores of Ellesmere Island fits the flat segment of PII-2012 that also has a hook to the north. These two segments were indeed connected before they separated from the glacier in 2010 and 2012. This is the reason, that the thickest part of the 2010 ice island is the shallowest part of the 2012 ice island, because the ice gets thicker towards the grounding line of Petermann Gletscher.

And finally, if you like puzzles, then you should consider a career in physical oceanography or physics or mathematics or electrical or mechanical or civil engineering. These are fields where jobs and careers are plentiful and people live long and happy lives: Preben chose Electrical Engineering 70 years ago in Denmark, I chose physical oceanography 30 years ago in Germany, and Allison chose physics 3 years ago in the U.S. of A. Sadly, few American students chose to compete for these jobs and lives, because they need to take a “difficult” undergraduate major. Allison did, she picked physics and oceanography, and so can you.

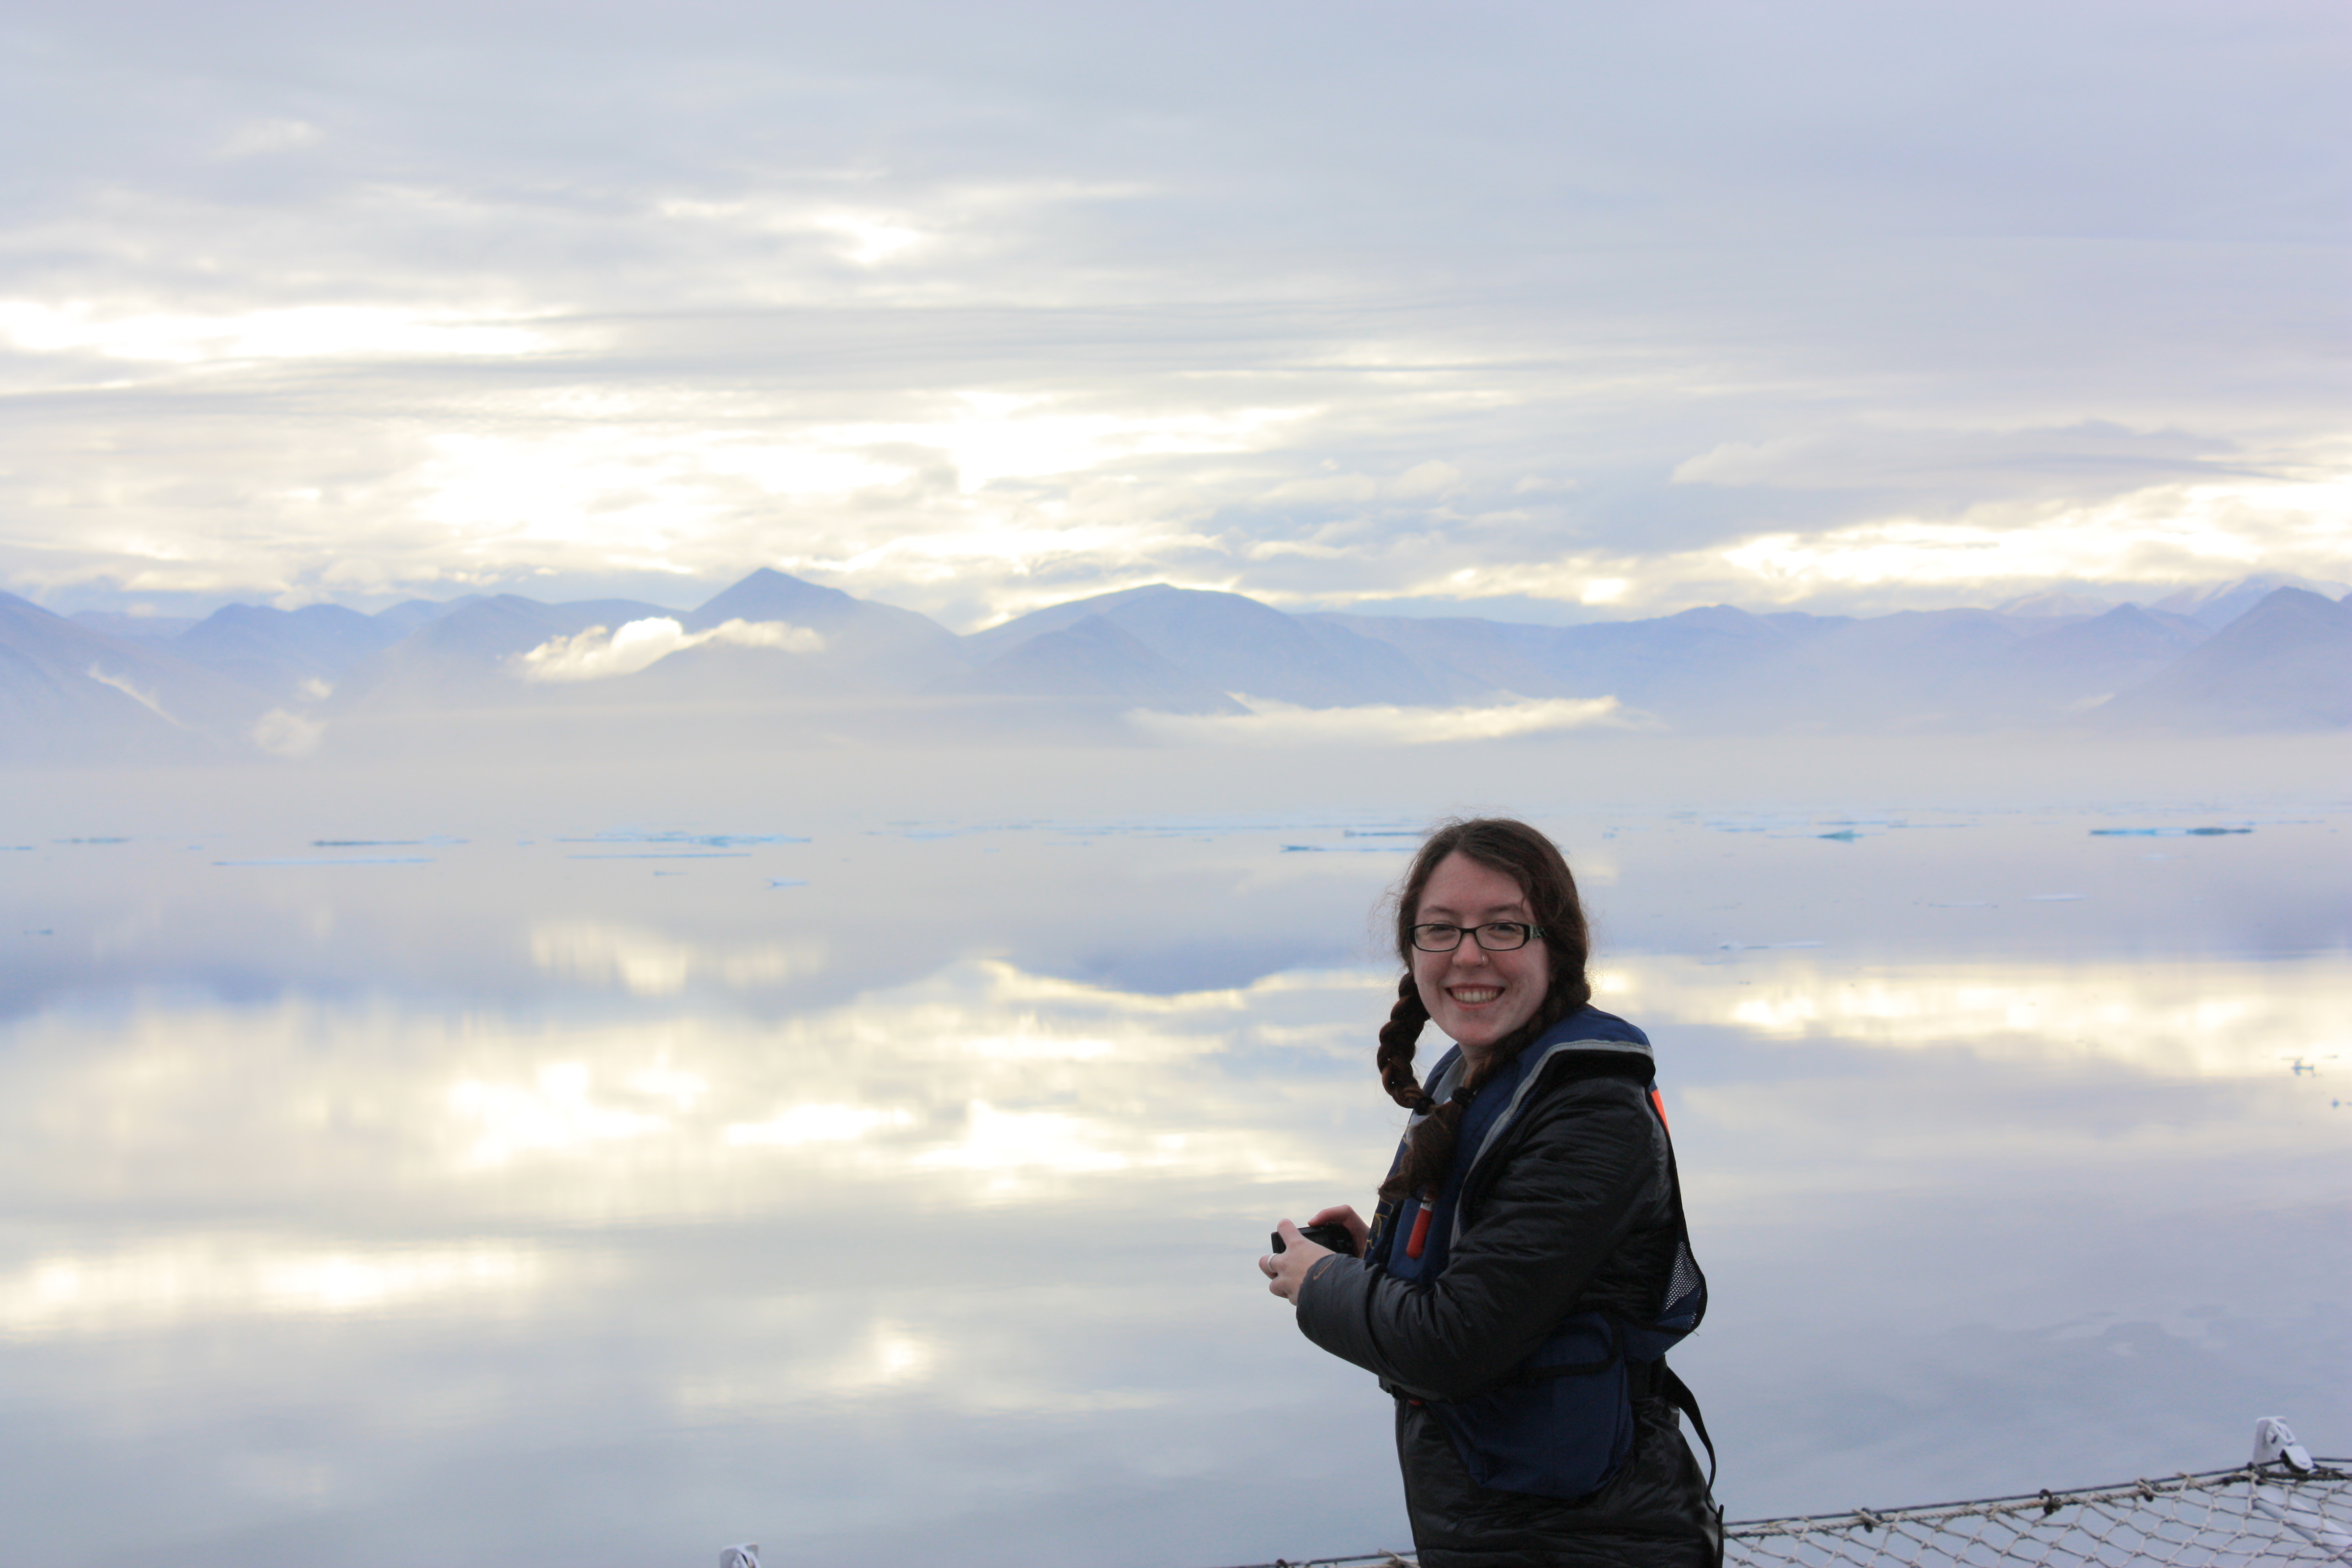
University of Delaware summer intern Allison Einolf from Macalester College, Minnesota in Nares Strait in Aug.-2012 aboard CCGS Henry Larsen. Allison studies physics. [Photo Credit: Jo Poole, British Columbia]

Arctic Ice Cover and Petermann Fjord, Glacier, and Ice Island Video Footage

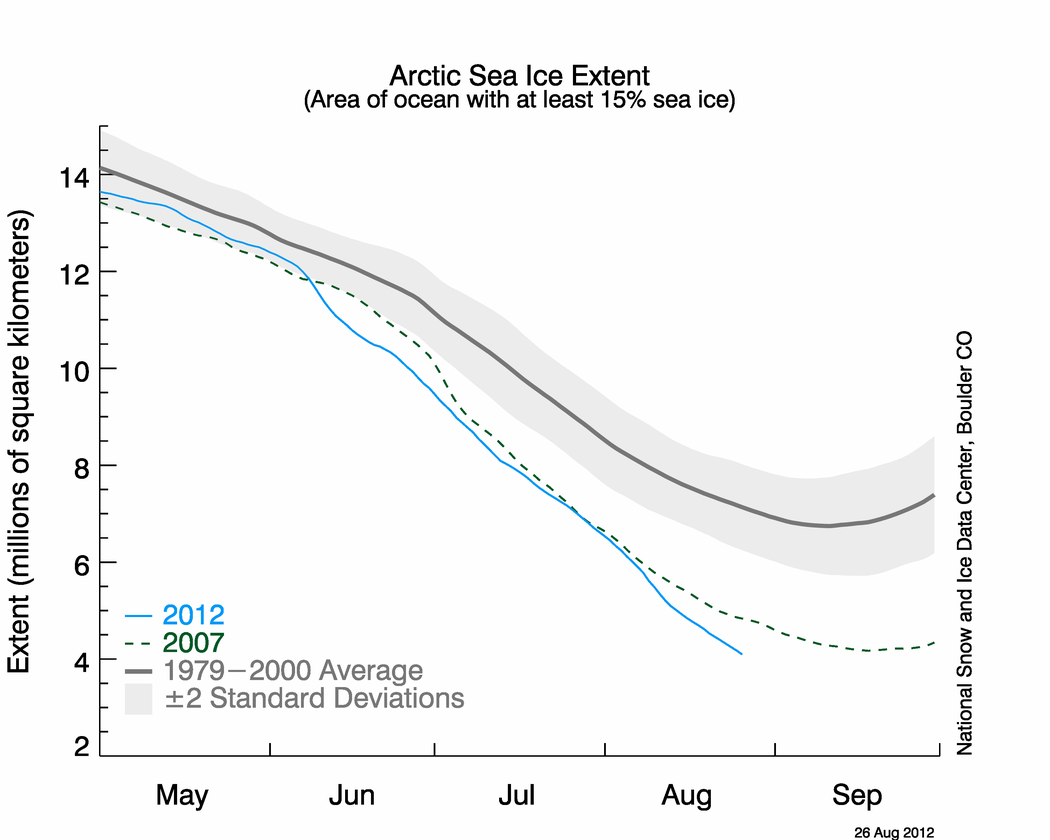
The National Snow and Ice Data Center announced today, that the Arctic Ice Area Extent has reached an absolute minimum breaking the record minimum of 2007 with still several weeks of potential melting and retreat to go. This has been anticipated for many weeks now with perhaps the most extensive coverage and intelligent discussions over at Neven’s Arctic Sea Ice Blog.

The graph above shows Arctic sea ice extent as of August 26, 2012, along with daily ice extent data for 2007, the previous record low year, and 1980, the record high year. 2012 is shown in blue, 2007 in green, and 1980 in orange. The 1979 to 2000 average is in dark gray. The gray area around this average line shows the two standard deviation range of the data. The 1981 to 2010 average is in sky blue. Sea Ice Index data. [Credit: National Snow and Ice Data Center]

This is as big a deal, because an ice-covered ocean reflects much more sunlight back into space in summer than a black ocean does that absorbs more heat: a positive feedback. This is why people in hot climates wear white, not black clothes, they like to stay cool. Furthermore, this decline has been ongoing for the last 30 years and the climate models that policy makers rely on did not predict this level of ice cover to occur for another 20-30 years. So, the warming climate and the changes it caused are on an accelerated schedule with regard to the Arctic Sea Ice cover. Also, the remaining ice cover is thinner than it used to be, because the multi-year ice keeps leaving the Arctic faster than it can be formed inside the Arctic. Both the Fram Strait to the east of Greenland and Nares Strait to the west of Greenland export this old, hard, and thick ice that ultimately melts further south. The ice that is left in the Arctic Ocean has become both thinner, younger, and softer, making it easier to melt the next summer.

On somewhat related news from the University of Delaware (UDel), we put two videos together that show a tiny, if spectacular example of a different area that has never been ice-free for at least 150 years when people were looking: Petermann Fjord. On August 10/11, 2012 the Captain and crew of the Canadian Coast Ship Henry Larsen gave us unfettered 18 hours access to the newly ice-free waters of this large glacier that discharges about 6% of the Greenland ice sheet. The UDel press release has the video that is also posted at youtube. As a less professionally assembled version is my first introductory iMovie project, e.g.,

Steensby Gletscher Sheds 10 km^2 Ice Island

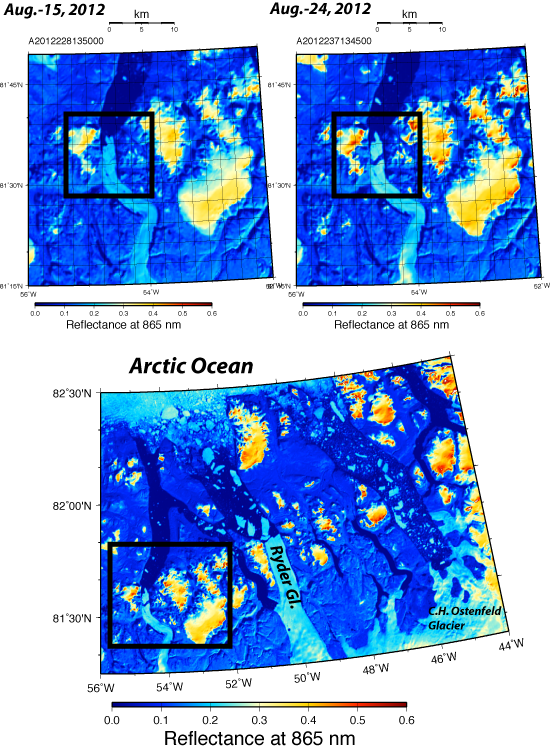
Following the rapid southward motion of Petermann’s 2012 Ice Island (PII-2012) via MODIS satellite imagery, I noticed a larger piece of Steensby Gletscher nearby breaking off. Steensby discharges into Sankt George Fjord whose upper reaches are narrower than Petermann’s (4.5 km vs. 15.5 km wide). The new ice island is smaller than the Manhattan-sized ice islands from Petermann, but it is still about three times the size of Manhattan’s Central Park (~ 10 km^2).

Steensby Gletscher and Sankt George Fjord on Aug.-15 and Aug.-24, 2012 (top) and fjords and glaciers of north-west Greenland facing the Arctic Ocean as seen by MODIS-Aqua on Aug.-24, 2012 13:45 UTC (bottom). All data are shown at 250-m spatial resolution. Note the segment of Steensby Gletscher which is separating from the glacier to form a new ice island.

The floating ice shelf of Steensby Gletscher is also two to three times thicker, but it moves more slowly. It appears, that a lateral crack or rift broke off sometime between Aug.-21 and Aug.-22, 2012 to form the ice island, this one about 1/10 the size of PII-2012. This latest calving is about 7 years of steady advance of this glacier. Comparing the front of the glacier with that observed in 1947, 1953, and 1971, I find its current site well within the earlier bounds reported by Dr. Anthony Higgins of the Geological Survey of Greenland. The same cannot be said for Petermann Gletscher about 40 nautical miles to the south-west. Unlike Petermann’s Ice Islands, Steensby’s are likely to linger and stay inside its fjord for several years as many of those calving from neighboring Ryder and C.H. Ostenfeld Gletschers do.

Michael Studinger of NASA’s IceBridge project provides stunning aerial photography of Steensby Gletscher when he flew over North-West Greenland in May of 2011.

Addendum 8-25: Mauri Pelto posted equally stunning high-resolution Landsat imagery and provides more context, analyses, and references.

Higgins, A.K., 1990: North Greenland glacier velocities and calf ice production. Polarforschung, 60, 1-23.

New Ocean Observations in Petermann Fjord

A new ice island separated from Petermann Glacier on July 16, 2012 as reported here first. Less than 4 weeks later, the Canadian Coast Guard Ship Henry Larsen reconnoitered the ice island on Aug.-9 when it blocked the northern half of the entrance of the fjord.

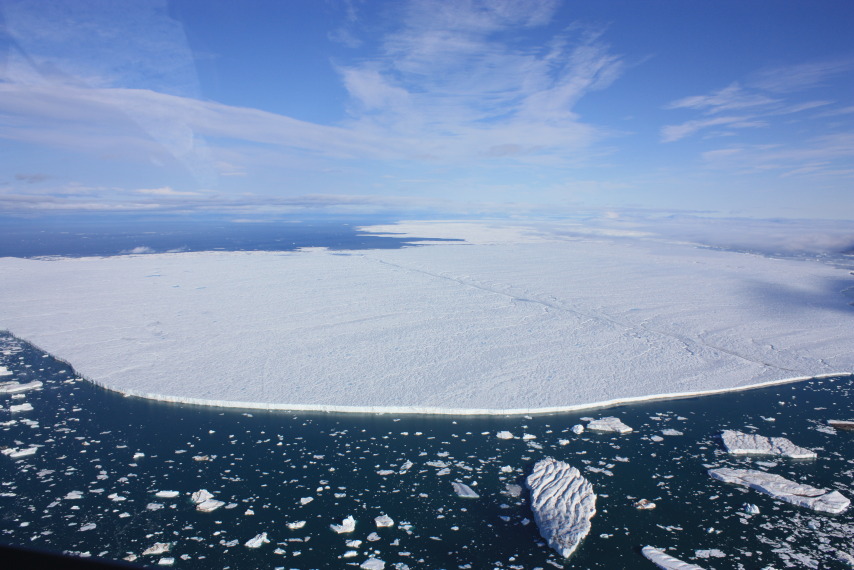
Petermann Ice Island 2012 (PII-2012) as seen Aug.-11, 2012 at the entrance of Petermann Fjord. The view is to the north-west. [Photo Credit: Canadian Coast Guard Ship Henry Larsen.]

I was aboard this ship when Captain Wayne Duffett decide to break into the largely ice-free fjord behind the ice-island after consultations with Ice Services Specialist Erin Clarke. The ice observer had just returned from her second helicopter survey in 2 days with pilot Don Dobbin to assess both ice cover and its time rate of change. From the time the ship entered the fjord behind the ice island, hourly flights to a fixed point at the south-western corner of the ice island ensured that its movement would not cut off the ship’s exit. This approach worked and it gave the science crew of 8 aboard about 18 hours to conduct the very first survey of a previously ice-covered ocean:

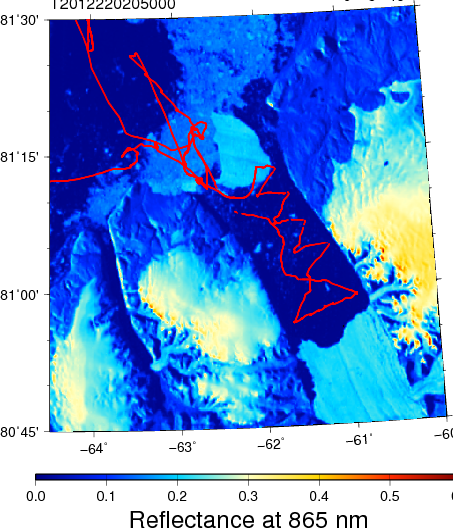
Petermann Glacier, Fjord, and Ice Island as seen by MODIS at 865 nm on Aug. 07, 2012 overlaid with survey lines of CCGS Henry Larsen on Aug.-9/10/11, 2012 in red.

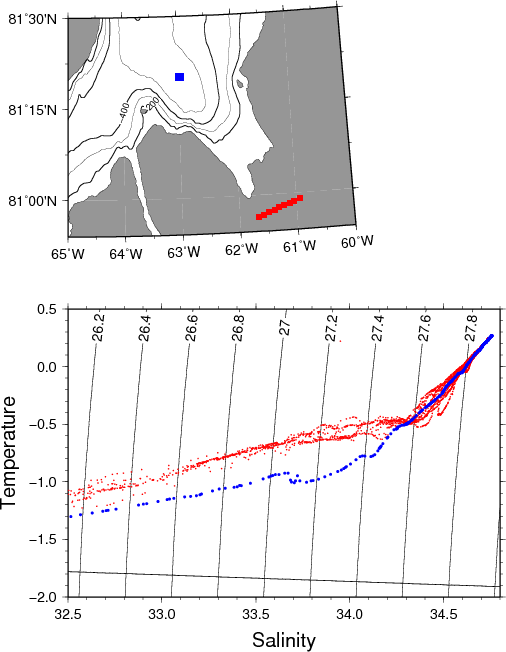
We were not funded to do enter the fjord, but our main mission to recover an array of ocean moorings with 3-year long data records covering the 2009-12 period about 100 km to the south in Nares Strait has already been accomplished. So, what does a physical oceanographer do when in uncharted and unknown territory? He drops a number of CTDs, that is, measuring conductivity (C), temperature (T), and depth (D, pressure, really) as the instrument (the CTD) is lowered at a constant rate from the surface to the bottom of the ocean at a number of stations. The results from such work next to the present front of Petermann Glacier was a surprise for which we do not yet have a satisfactory explanation: The waters inside the fjord are much warmer at salinities 32.5-34.25 than they are outside the fjord:

Temperature as a function of salinity from 9 stations across Petermann Fjord next to the current seaward edge of Petermann Glacier on Aug.-10, 2012 in red. For comparison I show in blue a station done outside the fjord on Aug.-9, 2012. Note that temperatures increase with increasing salinity which is expected for waters that are a mixture of cold and fresh polar and saltier and warmer Atlantic waters. Density deviations from 1000 kg/m^3 are shown as solid contours along with the freezing temperature that decreases with increasing salinity.

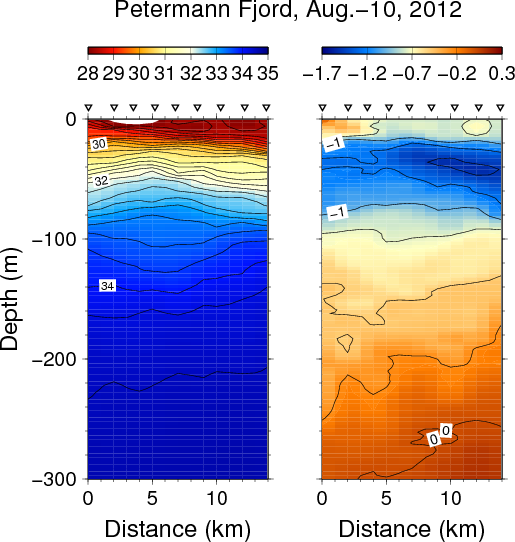
Another way to show the same data is to actually plot the section, that is, the distribution of temperature and salinity in physical space across the fjord as a function of depth:

Section across the seaward edge Petermann Glacier on Aug.-10, 2012 for salinity (left panel) and temperature (right panel). Symbols indicate station locations from which color contours are drawn. Note that the display is cropped to the top 300 meters while real recordings extend to the bottom which exceeds 1000 meters. The view is eastward towards the glacier with north to the left.

Note the doming salinity contours which to classically trained oceanographers suggest a flow out of the page on the right and into the page on left with maximum at about 90 meter depth relative to no flow at, say, 500 meter depth. Another way to view this distinct property distribution is that the flow above 90 meters is clockwise (outflow on left, inflow on right) relative to the more counter-clockwise flow below this depth. This feature, too, comes as a surprise and requires more thought and analyses to explain.

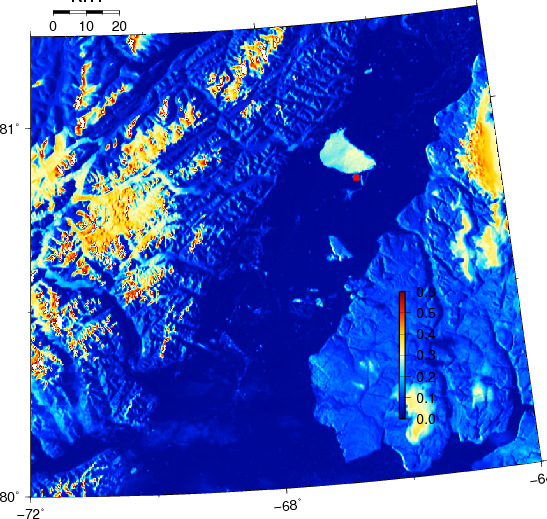
There is much more work to be done to figure out what all this means. I feel like scratching the surface of a large iceberg half-blind. The data from below 300 meter depth, too, contain clues on how some this glacier interacts with the ocean. As for the purpose of this post, I merely wanted to report that the ice island is presently having a hitting or scratching tiny Hans Island. The latter is unlikely to move, but Petermann’s Ice Island will slow on impact, swivel counter-clockwise, bump into Ellesmere, and pretend nothing has happened on its merry way south. This is the latest image I have:

Petermann Ice Island 2012 on Aug.-22, 2012 as seen by MODIS Terra at 21:45 UTC. The tiny red dot marks Hans Island, the location of a weather station in the Kennedy Channel section of Nares Strait. Petermann Fjord is towards the top right out of view.

ADDENDUM Sept.-1, 2012: PII-2010B had a maximum thickness of at least 144 meters as it passed over a mooring that measures ocean currents from the Doppler shift of acoustic backscatter that is shown here for one of four beams:

Time-depth series of acoustic scatter from a bottom-mounted acoustic Doppler current profiler for 24 hours starting Sept-22, 2010 9:30 UTC. Red colors indicate high backscatter from a “hard” surface like ice. The vertical axis depth in meters above the transducers while the horizontal is ensemble number into the record (0.5 hours between ensembles). The 2010 ice island from Petermann Glacier (PII-2010B) passed over the mooring. When PII-2010B was attached to the glacier it was adjacent to the segment that became PII-2012 this year.