
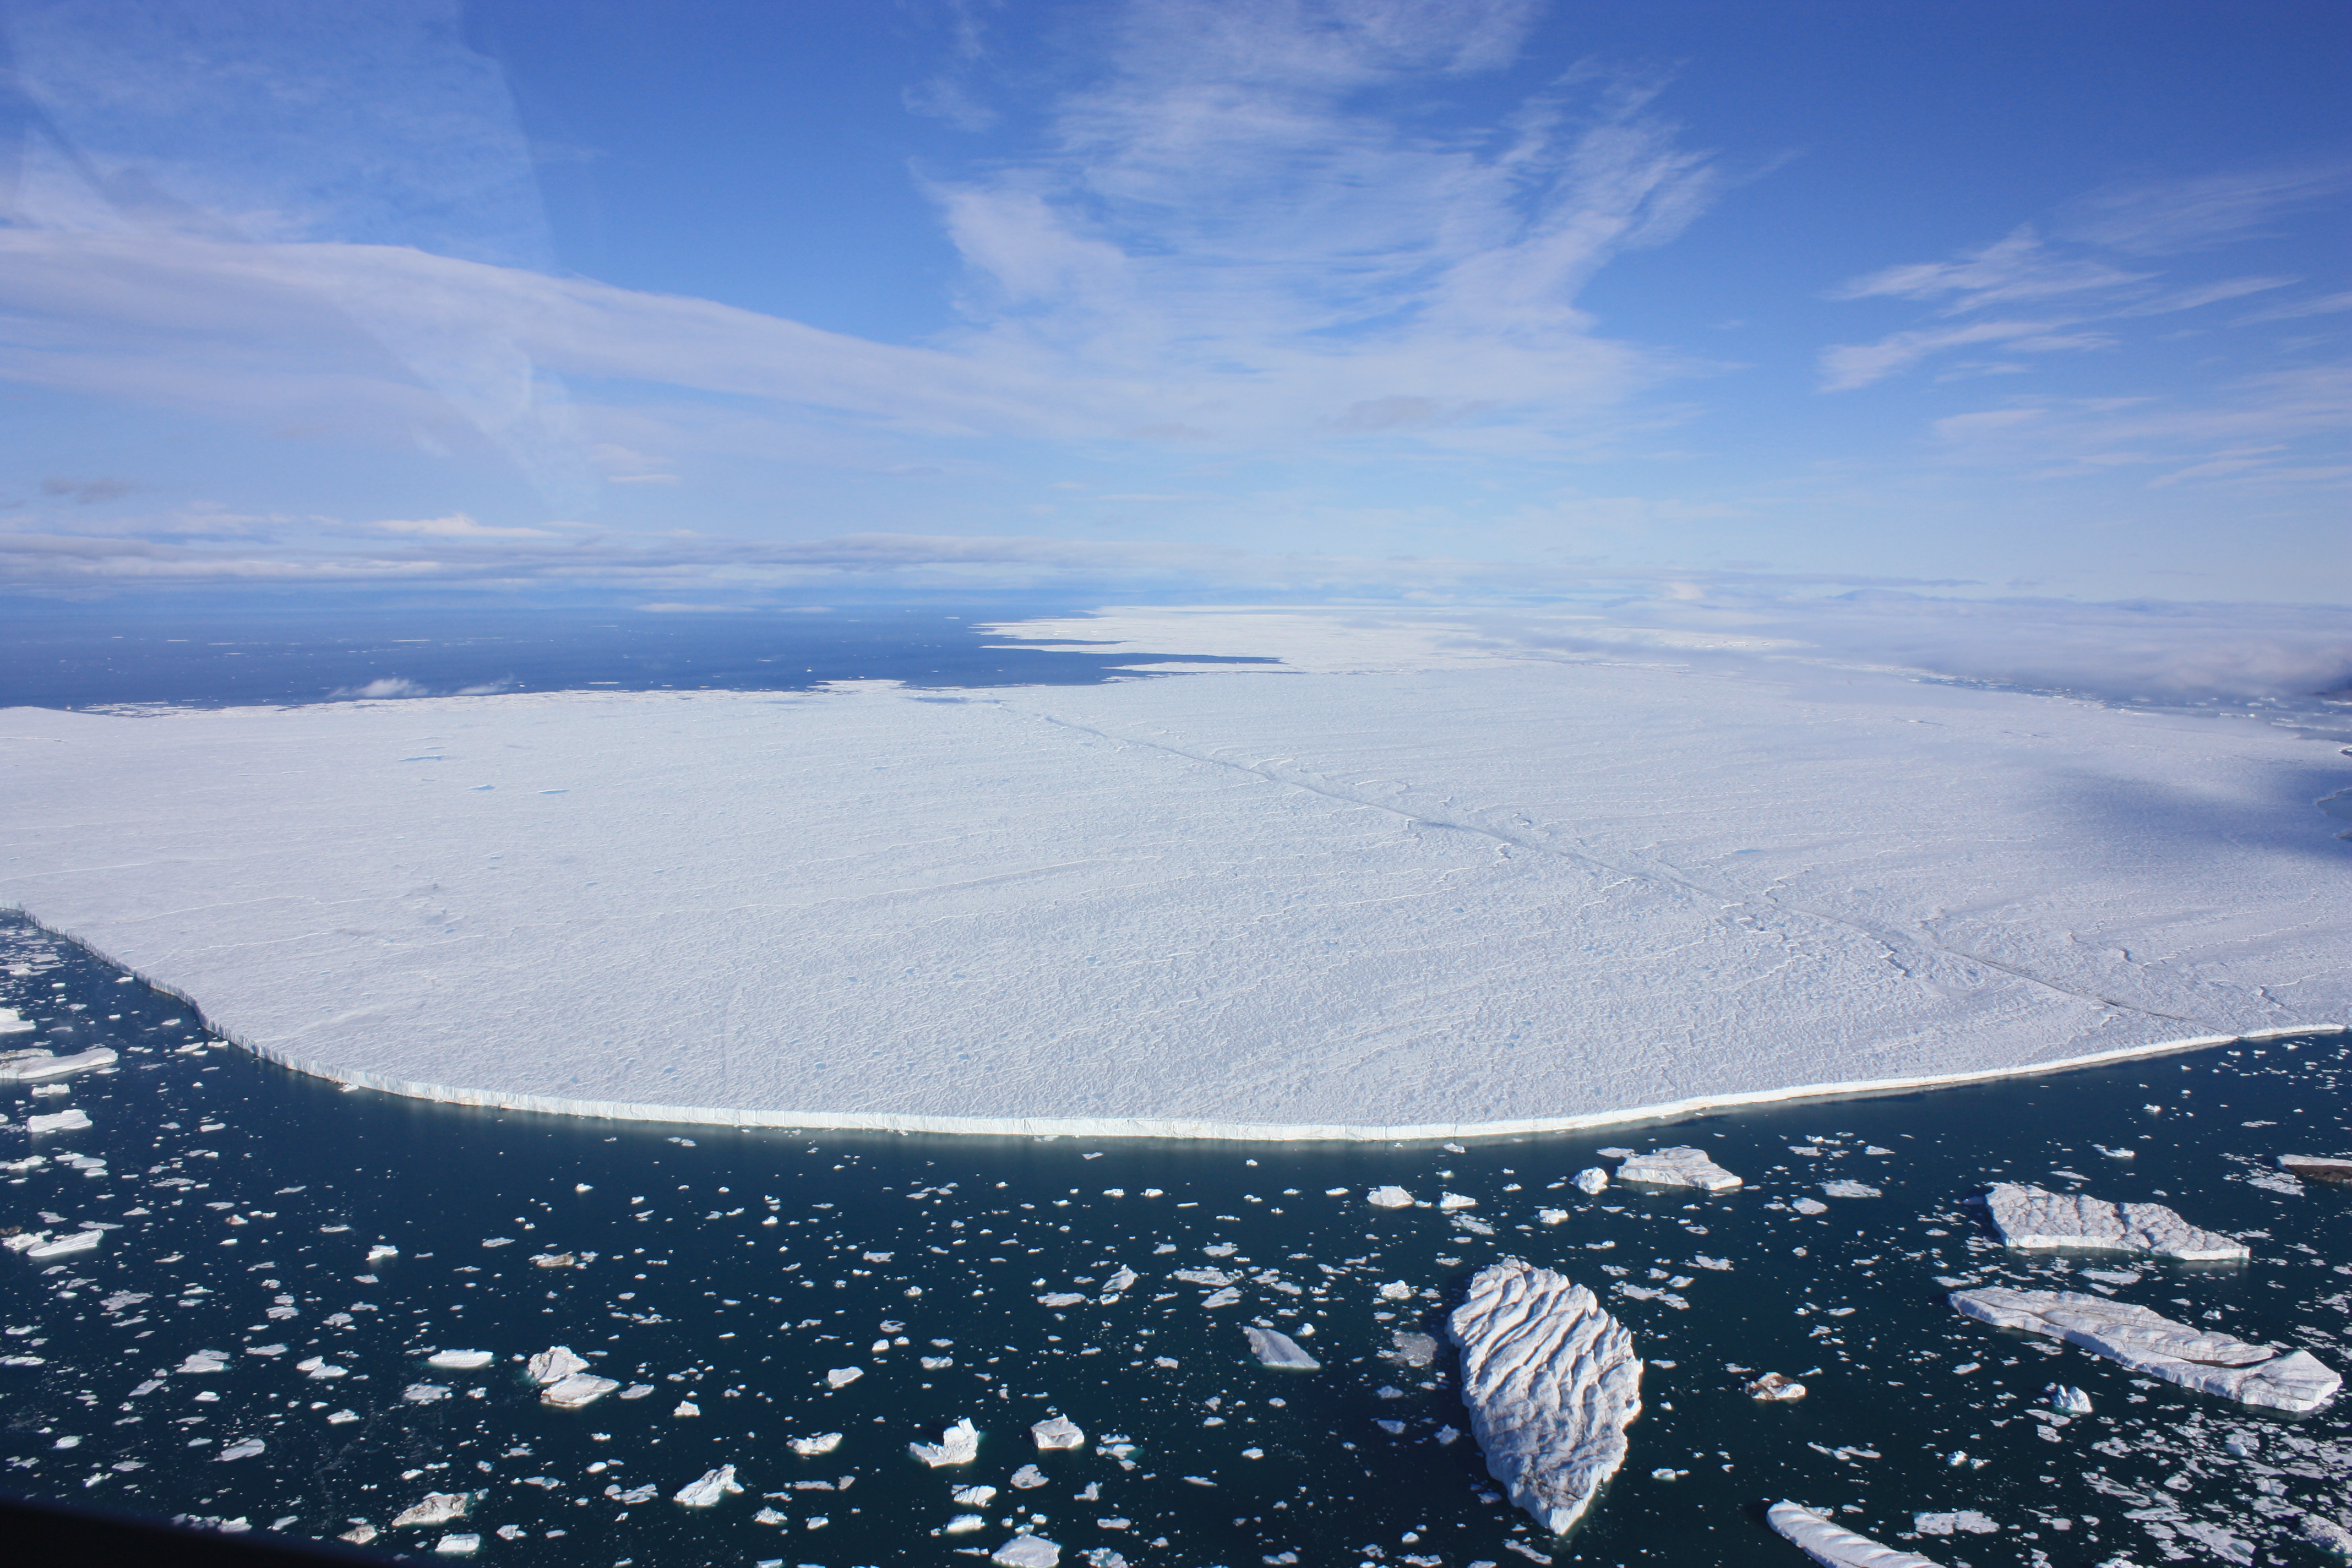
The Manhattan-sized ice island that last year broke free of Petermann Gletscher in North Greenland plowed into the bottom and broke apart. Force equals mass times acceleration. When 18 giga tons (mass) of moving ice crashes into the ocean’s bottom 200 meters below the surface (acceleration), then something gotta give. And give it did, as this single ice island is now at least 2 ice islands and a number of large icebergs. It does not take much speed for a heavy truck running into your parked car to demolish it. Something gotta give, your car, or in this case, the ice island shattering into pieces. Here is the piece, about twice the size of Manhattan by area.
We saw it last year as we entered Petermann Fjord by ship as the ice island left the same fjord to drift into Nares Strait. It then sailed towards Kane Basin where it got stuck for much of the 2012/13 winter to help keep the ice arch across Nares Strait more stable than it has been in a long time.
Terry Moran alerted me on these pages to the break-up that is also discussed on the Arctic Sea Ice forums, but the optical MODIS satellite imagery that many of us are addicted to do not show as much as we like to, because this sensor does not penetrate clouds. And it has been very cloud over Nares Strait much of this summer, more than in most earlier years anyways. There was a partly clear image yesterday that I overlay with the ocean’s bottom depth, but I only show the contour for 200-m and 300-m depth, because I know (more on that later) that the deepest part of the ice island is 200 meters below the sea surface. It is a very thick ice-cube.

Petermann Ice Island on Sept.-11, 2013 off the coast of Ellesmere Island, Canada as seen by MODIS. Also shown are contours of 200-m and 300-m bottom depth. Blue colors are open water, grey is land, and diffuse whites are clouds.
So, I here use radar imagery that was sent to me an hour ago that tells the same story a little cleaner as this radar can see through the clouds much like an x-ray can see through our bodies.
-

- Sept.-08, 2013
-

- Sept.-10, 2013
-

- Sept.-11, 2013
Now how do I know that this ice island extends 200 meters (600 feet) below the surface? It all started with a post titled Shots of airborne lasers at Petermann Gletscher. This post developed into a talk with friends and colleagues over the winter and spring that jellied into a paper on this very subject that we have submitted for publication. Using lots of fancy satellites and sensors flown aboard planes such as lasers and ice-penetrating radars, three of us describe in much technical detail how thick the floating ice of Petermann Gletscher is and how it has changed over the last 10 years or so. Hence we have very detailed measurements of this ice island while it was still attached to the glacier in 2002 and 2007 and 2010 and 2011. It broke off in 2012, but it probably has not melted much just yet as it is still in very frigid Arctic waters.
There is another interesting tidbit on the very clean fracture line where the ice island broke apart the day before yesterday. As many other floating glaciers Petermann has a central channel that runs near its center all along the glacier where it is floating. I do not know why it is there or what makes it, but at this central channel the glacier (or ice island) is about 100 m thinner than either to its side. It is along this channel that the ice island broke apart into two new pieces of almost equal size. And just to add to the mystery, there are many more such channels oriented along the flow direction. It is a unique feature of many large floating glaciers both around North Greenland and Antarctica.
-

- Central channel from above.
-

- Flying towards central channel.
-

- Flying into central channel.
ADDENDUM Sept.-14, 2013: We actually made a video from inside Petermann Fjord last year that includes footage of the helicopter flying into the central channel ((YouTube video), the photos do not do justice to the immense scale.
Johnson, H., Münchow, A., Falkner, K., & Melling, H. (2011). Ocean circulation and properties in Petermann Fjord, Greenland Journal of Geophysical Research, 116 (C1) DOI: 10.1029/2010JC006519
Rignot, E., & Steffen, K. (2008). Channelized bottom melting and stability of floating ice shelves Geophysical Research Letters, 35 (2) DOI: 10.1029/2007GL031765


Two points; you tell that it has been very cloudy over Nares Straight this year. Could that be in any way connected with the Chelyabinsk meteor plume that NASA has tracked and which blanketed almost the entire area of the Arctic? I would have thought such would have produced a substantial meteorlogical effect. http://www.nasa.gov/content/goddard/around-the-world-in-4-days-nasa-tracks-chelyabinsk-meteor-plume/#.UjLSKn-GeSo
You go on to describe: “As many other floating glaciers Petermann has a central channel that runs near its center all along the glacier where it is floating. I do not know why it is there or what makes this it, but at this central channel the glacier (or ice island) is about 100 m thinner than either to its side. It is along this channel that the ice island broke apart into two new pieces of almost equal size. And just to add to the mystery, there are many more such channels oriented along the flow direction. It is a unique feature of many large floating glaciers both around North Greenland and Antarctica.”
Is the central channel formed by melt water from UPSTREAM of the glacier, indeed any glacier? It has long been my contention that arctic science has a blind spot regarding the enormous kinetic potential energy of what are, in reality; the largest hydraulic systems on the planet. That the melt water should be seen in the same context as a hydroelectric generating system dam; but one of quite astounding proportions; that the trickle of water from the glacier surface passing down through the ice should be seen in the same light as a drop of water at the surface of a contained body of water behind a dam, but with up to several miles depth of that water beneath it.
If that is the case, then as that single drop of water works its way down through several miles of the ice column, it is in fact also imparting the kinetic energy to the structure of the glacier. That that melt water, now not generating electricity; but heat; adds to the mass of the full depth glacier; the equivalent of the energy density of a comparable hydro electric dam.
In which case, underneath the glacier you have this mechanism; a dramatic, unseen, plume of water and associated, dynamically heated, debris. This is a set of images of a visible plume from flooding on the Yellow River. Now imagine if the water column above such a plume were, (as it must be), several miles deep; many orders of magnitude more than here: http://en.rocketnews24.com/2013/07/21/thirty-million-tons-of-water-and-silt-rocket-out-of-yellow-river-dam/
Simple hydraulic energy equations http://en.wikipedia.org/wiki/Hydropower
My calculations tell me that
During the Greenland Ice Sheet melting season of roughly 30 days a very large proportion of the 1.7KM3 of upper surface melt water flows down from the surface to the glacier base via Moulins. The Peterman Glacier drains 6% of the total ice sheet. The ice sheet is up to 3,000m thick but for this debate I am assuming the maximum height of the Moulins is 2,000m AMSL
During the melt season, there will be a flow of melt water, from Moulins into the Peterman Glacier of 39,352 Litres per second from a hydraulic head of 2,000m which gives an energy input of 770MW/s or 2.78TW/hr.
(Taken from: A short note to add some new thinking to the energy inputs influencing the formation of the Peterman Glacier Ice Tongue, September 23, 2012), a copy of which I was led to believe Trudy Wohlleben sent to you shortly after I sent it to her. (I am NOT a scientist, this was not published).
As I see it, this is what is heating the water beneath the glaciers, (NOT warmer oceanic water), and this is what is creating the grooves beneath the surface of the ice tongues in every location where similar effects are already documented.
Food for thought?
1. Meteor Plume: I do not think this plume had much impact on the general circulation of air (and thus cloudiness) over Greenland or the northern hemisphere.
2. Sub-glacial channels: They probably result from a combination of factors that includes frictional release of heat to the ice-sheet all along its path from the moulins far upstream towards the ocean. Such waters are also ladden with rocks, sediments, and till as this mixtures carves itself both into the ice and bed rock over time. Glacier movement over rough topography, too, perhaps changes the underside of the glacier as it detaches from the bed rock and becomes floating. I am not sure, if ocean melting preferentially takes place in these channels or not. The plumbing of glacier hydraulics and its connection to glacier and ocean dynamics is certainly an area awaiting many new discoveries … exciting times.
Exciting times indeed. My point regarding the meteor plume was with regard to a lowering of energy levels from the Sun due to the dust in the upper atmosphere, while at the same time, there does appear to be a slight reduction in the loss of Arctic ice this year. On the other hand, surely the dynamics of the atmospheric circulation is strong enough not to be significantly reduced in such circumstances?
The world’s first hydroelectric plant built in permafrost:
http://www.niras.dk/Aktuelt/Nyheder/2012/Verdens-foerste-vandkraftvaerk-anlagt-i-permafrost.aspx
and
http://ing.dk/artikel/nu-bruser-vandet-igennem-verdens-foerste-kraftvaerk-anlagt-under-permafrosten-161575
In Danish.
Yes on the atmospheric circulation. Much larger volcanic eruptions and dust clouds high up in the atmosphere have (limited) impacts. Still, I’d place my bets here on weather and variability that does not follow simple linear cause and effect rules. Same with the Arctic ice cover, it goes up and it goes down, but ice volume is decreasing rapidly (and NOT linearly) on decadal time scales. An excellent visualization is
http://www.skepticalscience.com/graphics.php?g=64
Thank you for that. The Polynomial Curve seems to like 2018 as it’s target. Nicely put together.
Andreas
Wonderful posting, as usual :>)
I would have expected PII-2-12-A-1-F to be thinner as the coriolis effect forced the incoming warm water to the south side of the fjord. I assumed that the thickest areas would have been close to the northern shore. Am I missing something?
Terry
Terry:
The missing piece is that data does not always show what we think it should show. That’s the beauty of experimental work. In the past I always called these elongated channels melt-channels, but I am not sure anymore that this is what they do. There are about 3-4 such channels, have a look at
Click to access Muenchow2013-JGlac.pdf
which shows and discusses Operation IceBridge (laser and radar), IceSat (altimeter), and MODIS data to estimate melt-rates across the glacier. Taking the first derivative (calculus) of MODIS single-channel data, I emphasize the optical shadows cast by highs of the undulating surface. You can faintly see this in the usual MODIS imagery also.