Dr. Preben Gudmandsen pioneered some of the early micro-wave remote sensors 30-40 years ago that are now used routinely to monitor sea ice, snow, and glaciers. Despite being “retired” for over 20 years, this Danish professor of Electrical Engineering is still very active in all things related to Nares Strait from sea ice, oceanography, glaciers, and winds. He is one of the main instigators to set up the automated weather station at Hans Island.

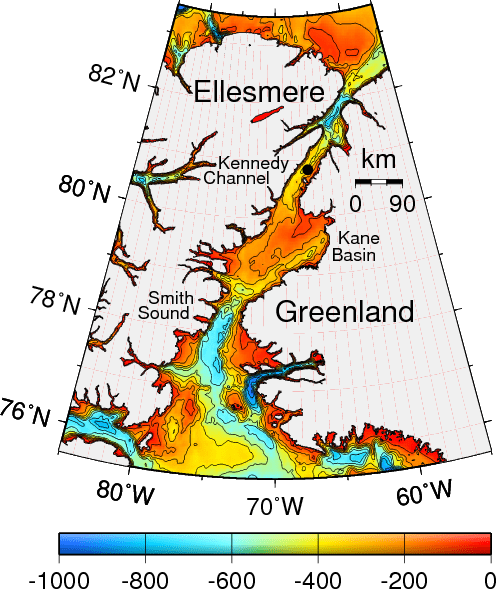
Nares Strait bottom depth (in meters) according to the International Bathymetric Chart of the Arctic Ocean (IBCAO, version 2, 2008). The black dot in the center of Nares Strait indicates Hans Island.
He also instigated the latest round of exchanges among “Friends of Nares Strait” about the fate of the ice island that broke off earlier this summer from Petermann Gletscher. He asked yesterday what may happen if PII-2012 reaches the sill separating northern Nares Strait and the Arctic Ocean from southern Nares Strait and the Atlantic Ocean. This sill is the deepest connection between the Arctic Ocean to the north and Baffin Bay in the south. The sill is in western Kane Basin off Ellesmere island and is about 220 meters deep.
So, to answer that question one needs to know three things: Where is the ice island, how deep is the water where it is, and how thick is the ice island. Before I could assemble these three things, however, the ice island has already broken into at least three pieces. Luc Desjardins of the Canadian Ice Service answered first by pointing this out. He has access to the commercial RadarSat data that few others have. So, here is the latest from MODIS which answers the first two questions:

Petermann ice island 2012 (PII-2012) breaking apart on Sept.-1, 2012 near the sill of Nares Strait. Faint black lines are bottom contours of 200, 150, 100, and 50 meter depth (IBCAO-2). Bottom left has clouds, top right is the mountainous terrain of Ellesmere Island. The most southerly part of PII-2012 is the thickest as it was attached to the glacier earlier this year. The most northerly section connected to PII-2010 which passed a moored array in place near Hans Island on Sept.-22, 2010.

Petermann Ice Island 2012 as one piece on Aug.-30, 2012 19:20 UTC in Kane Basin over contours of bottom topography.
From the above two MODIS images over contours of bottom topography, the shallowest water that PII-2012 has seen is the 150-m contour to the east towards Greenland. It is possible, however, that PII-2012 may also have hit some shallow topographic feature not properly charted in IBCAO-2008 (there is a 2012 version, I just learnt) or not properly contoured by me. Lets move on the next question, how thick is this ice island?
From data we recovered 3 weeks ago I can say, however, that PII-2012 is thicker than 144 meters. I base this estimate on the ice island that formed in 2010 and that passed over our moored array on Sept.-22, 2010. It hit two ice profiling sonars at 75 meters and damaged the stainless steel guard cage designed to protect the sensors (which they did), e.g.,

Two Ice Profiling Sonars (IPS) aboard the CCGS Henry Larsen in Aug.-2012. The bent stainless steel protective frame was bent by the 2010 ice island that hit both instruments in Sept.-2010. [Photo Credit: Andreas Muenchow]
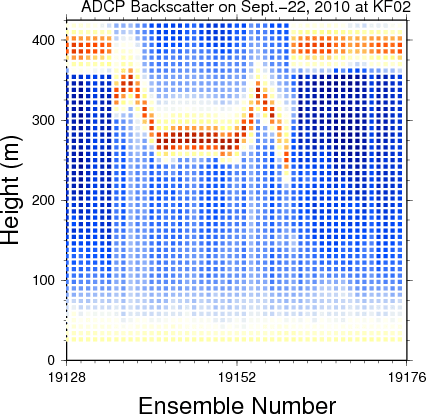
Another instrument moored deeper at ~360 meter depth sends out acoustic pings and measures how much sound comes back. A weak scatter like some microscopic plankton or grain of mud or sand in the water reflects little energy, but a hard surface like the ice floating atop reflects lots. And here is how a time series of this backscattered energy looks like when an ice island passes over:

A 24-hour segment of acoustic backscatter from a bottom-mounted acoustic Doppler current profiler is show to vary with time and height above the bottom. The dark red represents the sea surface and/or the bottom of ice floating on it. Vertical resolution is 8 meters, temporal resolution is 30 minutes for a 3-year deployment. The main purpose of this instrument is to measure ocean currents at the same spatial and temporal resolution as shown here for backscatter. PII-2012-B passed over the instrument on Sept.-22, 2010 and is here estimated to be about 144 meters thick.
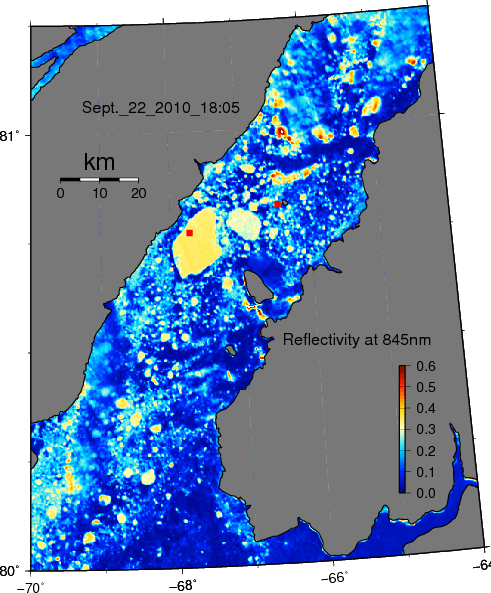
The exact place of the mooring and the time that PII-2010-B was on Sept.-22, 2010 is shown in this MODIS image of that day:

Location of ADCP mooring site (red square) with Petermann Ice Island 2010 segment B overhead on Sept.-22, 2010.
If you like puzzles, then you will like physical oceanography or any field of science or engineering. If you like puzzles, you will correctly notice, that the flat segment of PII-2010-B oriented parallel to the shores of Ellesmere Island fits the flat segment of PII-2012 that also has a hook to the north. These two segments were indeed connected before they separated from the glacier in 2010 and 2012. This is the reason, that the thickest part of the 2010 ice island is the shallowest part of the 2012 ice island, because the ice gets thicker towards the grounding line of Petermann Gletscher.
And finally, if you like puzzles, then you should consider a career in physical oceanography or physics or mathematics or electrical or mechanical or civil engineering. These are fields where jobs and careers are plentiful and people live long and happy lives: Preben chose Electrical Engineering 70 years ago in Denmark, I chose physical oceanography 30 years ago in Germany, and Allison chose physics 3 years ago in the U.S. of A. Sadly, few American students chose to compete for these jobs and lives, because they need to take a “difficult” undergraduate major. Allison did, she picked physics and oceanography, and so can you.


Between the 31 & the 1st PII2012 rotated about 40 degrees clockwise without forward motion, The center of rotation seems to be about where the two major splits meet at the front. It’s possible that I’m seeing a single crack starting from there toward the west in the image from the 31st.
Using arctic.io’s split zoom feature for comparison.
Terry
Very nicely done and some very interesting information on these fragments early journey
Pip
PII2012 has been on the move again since the 13th – and there’s still more time before spring tide on the 18th.
I’ve been finding arctic.io’s Split Zoom feature the easiest way to track small movements without having to do photoshop layering.
Terry
Pingback: Petermann and Ryder Glacier Ice Island | Icy Seas
Pingback: Petermann Ice Island Breaks while Plowing into the Bottom | Icy Seas