Greenland is warming, Greenland’s warming is melting its ice, and Greenland melting ice is raising global sea level. All true, but it all has happened before during the last 100 years or so. Our technology to extract small signals buried deep in noise from both our backyard and remote Greenland is unprecedented. This skill should not fool us, that the large changes that we see in Greenland and elsewhere have not happened before. They have, but memory is a fickle thing, as “new” is exciting, while “old” is often forgotten and considered unimportant. Those who live in the past are doomed to miss the present, those who ignore the past, are doomed to repeat it. We need to learn from the past, live in the present, and prepare for the future.
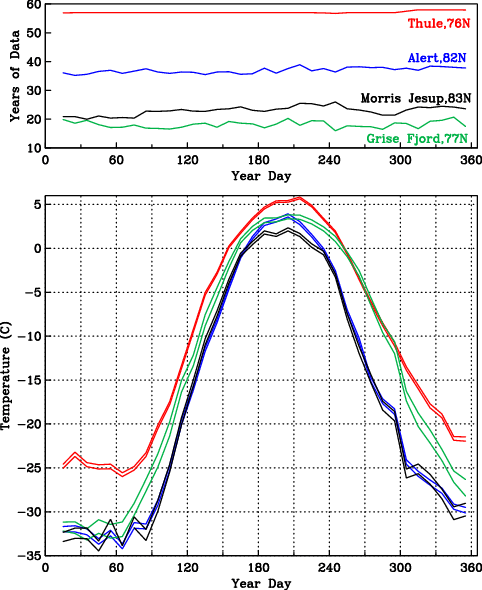
Preparing for an expedition to Nares Strait between northern Greenland and Canada in about 5 weeks, I am exploring temperature data from land, satellites, and ocean sensors to get a feel for what has changed. I started with data from weather stations such as the U.S. Air Force Base Thule , Canada’s former spy station Alert, and Denmark’s Station Nord about 700-1000 miles from the North Pole. So, it is cold up there:

Annual cycle of air temperature (bottom panel) from south to north at Thule (red), Grise Fjord (green), Alert (blue), and Cap Morris Jesup. Data years (top panel) for each year day are degrees of freedom. For each place two temperature curves indicate upper and lower limits of the climatological mean temperature for that day at 95\% confidence.
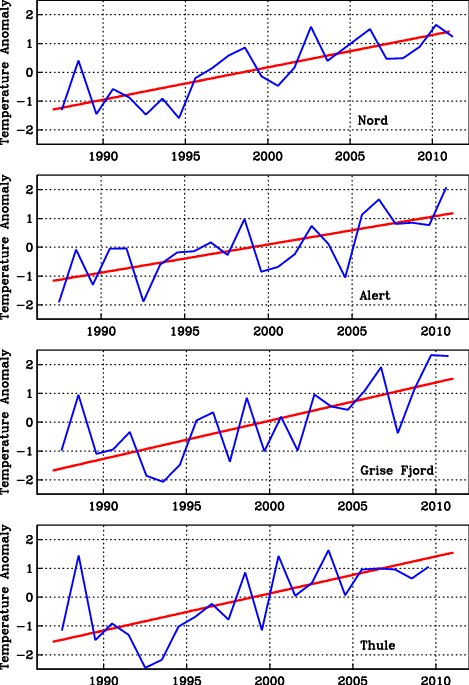
Well, we knew that, but the real question is: Has anything changed? Has Global Warming reached Greenland? The plot above does not tell, but this one does:

Annual averages and trends of air temperature anomalies for the 1987-2010 period for (top to bottom) Station Nord (Greenland), Alert (Canada), Grise Fjord (Canada), and Thule (Greenland). Scales are identical. The trends are fitted to daily, not annual data. The annual averages are shown for display purposes only.
To some it screams: “Warming, melting, Greenland is surging to sea.” [It is, but it did so before.]
There is lots of fancy signal processing that goes into this (see Tamino or a class I teach) to make a firm statement:
The air around northern Greenland and Ellesmere Island has warmed by about 0.11 +/- 0.025 degrees Celsius per year since 1987. North-west Greenland and north-east Canada are warming more than five times faster than the rest of the world.
This must be huge (yes, it is), it must have an effect on the Greenland ice sheet (yes, it does), and this must raise sea level (yes, perhaps 10 cm or 3 inches in 100 years, Moon et al., 2012).
Now where is the catch?
The catch is that my records all start in 1987, because that is the period for which I have actual measurements from all those stations. My satellite record is even shorter: it starts in 2000, but with lots of work can be extended back to 1978. And my ocean record is shorter yet: it starts in 2003. There just are no other hard data available from north-west Greenland.
So, does this mean we are stuck with the gloom and doom of a short record?
No, but we have to leave the comforts of hard, modern data with which to do solid science. People have to stick out their necks a little by making larger scale interferences. Based on the 1987-2010 results shown above, I can now say that trends and year-to-year variations are all similar in Alert, Thule, Kap Morris Jesup, etc., etc., so I will use the 60 year Thule record to make statements that somewhat represent all of Nares Strait. I could also start looking for softer and older data. With soft data I mean sketchy ship logs kept by whalers, tense expedition reports of starving explorers (Lauge Koch, Knud Rasmussen, Peter Freuchen), and imperial expeditions (George Nares, Adolphus Greely).
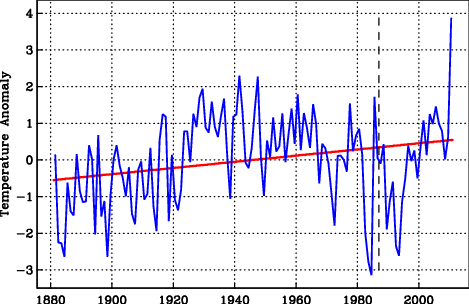
Further south there are a few ports where government or trading authorities started records early. The current capital of Greenland, Nuuk (formerly Godthab) is such a place. The Nuuk record starts 1881. And what I find is that the current warming in Greenland has happened just as dramatic as it does now in the 1920ies and 1930ies [well, except for the 2010 spike, but that story is still ongoing]:

Data from Nuuk, southern Greenland, where the temperature record goes back to 1881 (monthly data from NASA/GISS). The dashed line indicates 1987.
The trend is statistically significant, about 0.008 +/- 0.03 degrees centigrade per year or about 10 times smaller than what it is for northern Greenland starting in 1987. So the devil of Greenland warming, melting, and sliding to sea is in the details or records that are too short. The Global Warming signal is in there, but how much, we do not know and perhaps cannot know. Furthermore, most of the globe of “Global Warming” is covered by water and the ocean warming we know little about. Recall, my ocean record off northern Greenland only starts in 2003 and ends in 2009 or 2012, if we recover computers, sensors, and data from the bottom of Nares Strait this summer.
Greenland’s data and physics of ice, ocean, and air are exciting and all show dramatic change. To me, this is a big and fun puzzle, but one has to be careful and humble to avoid making silly statements for political purposes that are not supported by data. Do I think Global Warming is happening? Absolutely, yes. Do I think it is man-made? Probably. What do I do about it? I ride my bicycle to and from work every day. And that’s what I do next … bicycle home.


Fascinating and very informative thank you so much for sharing your knowledge and insight.
Remember that Moon et al (2012) focused only on volume change via discharge not from surface melting. So glaciers like Mittivakkat or Sarqardliup Sermia do not count
How much of a contribution do you think these neglected glaciers make? If I understand this correctly, then ocean melting underneath the floating ice sheets (Petermann, Ryder, Nioghalvfjerdsbrae/79 Glacier, etc.) is then neglected also? Either way, I do need to read Moon et al. (2012) more careful again, but I thought it was an improvement of Tad’s estimate (Pfeffer et al, 2008) with much tighter error bars.
The excellent Moon et al (2012) is an improvement on an examination of the acceleration due to dynamic changes. It simply does not attempt to, which is fine, account for changes due to surface melting. For land terminating Greenland glaciers which have had little dynamic change, all of the sea level contribution has been from surface melting, which was not part of the studies calculation. Miitivakkat illustrates this. IN the paper you will also note that thickness changes are not examined, the focus is just on velocity. So yes basal melting that leads to thinning but no acceleration would be missed.
“In Greenland, this work assumed ice-sheet–
wide doubling of glacier speeds (low-end scenario)
or an order of magnitude increase in speeds
(high-end scenario) from 2000 to 2010. Our wide
sampling of actual 2000 to 2010 changes shows
that glacier acceleration across the ice sheet remains
far below these estimates, suggesting that
sea level rise associated with Greenland glacier
dynamics remains well below the low-end scenario
(9.3 cm by 2100) at present”
Reading Mernild et al (2011) to learn more about Greenland’s land-terminating glaciers. Also, the melting of ice shelves from the ocean below does not raise sealevel, but the accelerated flux at the hinge-line and thinning of floating ice shelf does. To me this would be a very dynamic effect. I’ll need to check what Moon et al. (2012) say on that process.
Re Nuuk temperatures: It seems that we will have a record warm june this year (to this date the average temperature is 7.9 C (according to dmi). The previous record is from 1888 where the average where 6.8 C. If this is “global warming” we want more of that §.-)
In northern Greenland the most dramatic changes (at least the last 10 years) are in the winter, not summer, but that’s a story for another day. Also, Nuuk is so far south relative to Thule and Nares Strait, that not all change in Greenland applies to all of Greenland. It is a huuuuuge island after all. Now I want to know how much of Europe one could cover with it 😉
Looks like Hans Island weather indicates air temperatures in excess of 8 C in the center of Nares Strait. Hans Island is ~1900 kilometres (1180 miles) from Nuuk to the north.
More a note to self than anything else. Land-terminating glaciers do contribute, but how much? Just found this New York Times article:
http://www.nytimes.com/cwire/2011/08/05/05climatewire-probing-a-glacier-as-it-thaws-93332.html
Pingback: Hurricane Sandy, Global Warming, and the Butterfly Effect | Icy Seas
Pingback: Petermann Gletscher Thawing and Thinning | Icy Seas
Pingback: Coastal Oceanography off North-East Greenland | Icy Seas