Ocean-Weather station data from Aug.-20 through Sept.-25 (today). Ocean temperatures at 5 vertical levels are shown as 5 red curves in 5th panel from top. The black lines in that panel are air temperatures that reached -20 C this week.

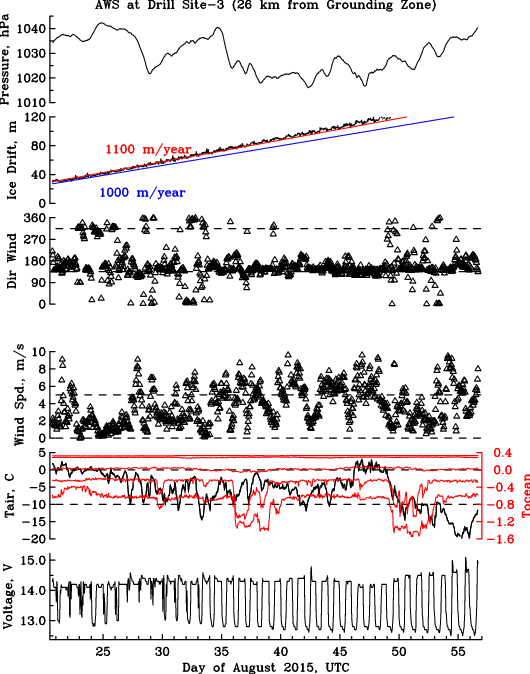
Ocean-Weather station data from Aug.-20 through Sept.-25 (today). Ocean temperatures at 5 vertical levels are shown as 5 red curves in 5th panel from top. The black lines in that panel are air temperatures that reached -20 C this week.